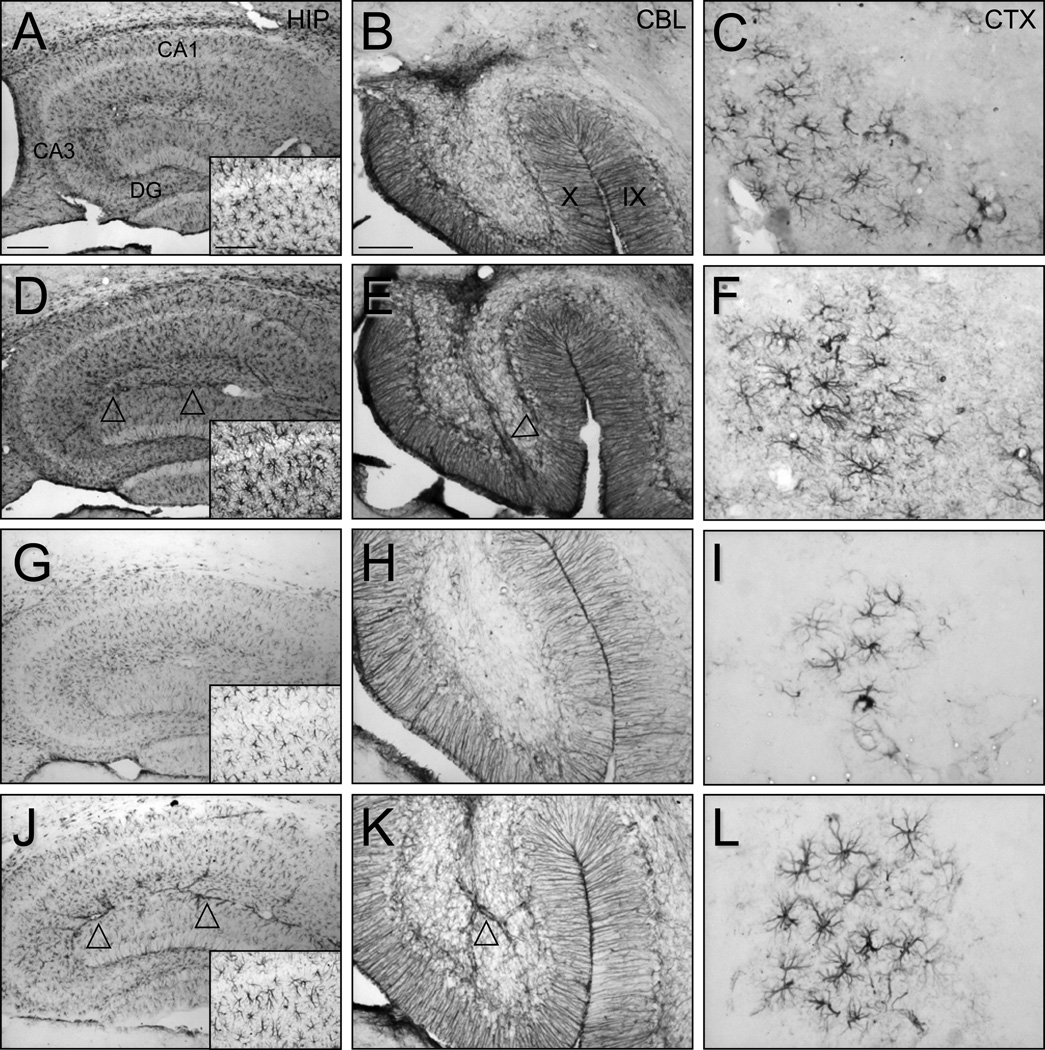
Figure 4.
Effect of ethanol on GFAP immunostaining and astrocyte morphology in adult and adolescent mice. Photomicrographs illustrate the appearance of GFAP stained astrocytes in vehicle (A-C, G-I) and ethanol (D-F, J-L) treated adult (A-F) and adolescent (G-L) mice. Arrowheads denote ethanol induced increases in GFAP staining of astrocytes associated with larger vascular elements. Inset: astrocytes in the hippocampal CA1 region. Animals were treated as described in Figure 1. Scale bars in A represent 200 um and 100 um (inset) and apply to all hippocampal images. Scale bar in B represents 100 um in B and E and 50 um in H and K and all cerebral cortex images. Hippocampus (HIP), hippocampal field CA1 (CA1), hippocampal field CA3 (CA3), dentate gyrus (DG), cerebellum (CBL), cerebral cortex (CTX).

