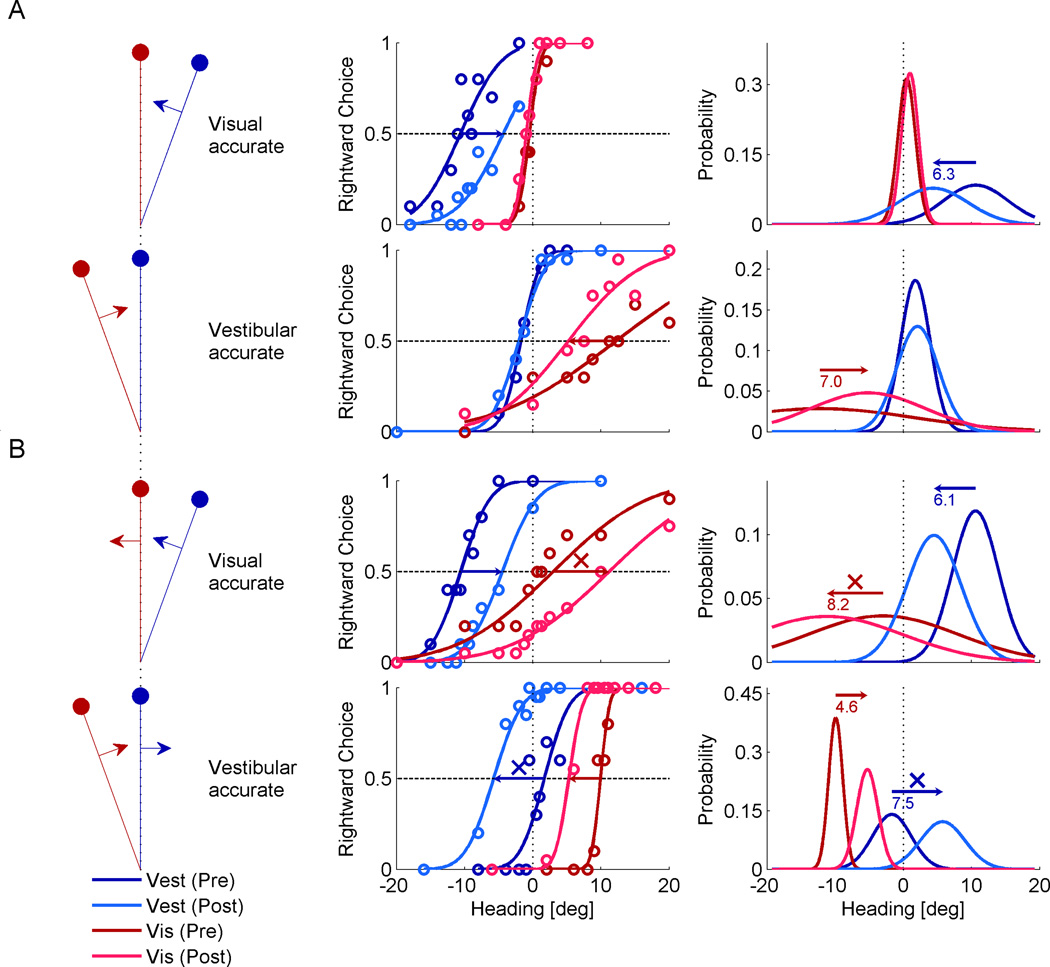
Figure 2. Examples of supervised visual-vestibular calibration.
Four example sessions of supervised calibration are presented (each combination of the cues being more/less reliable and accurate/inaccurate). The heading discrepancy for all examples here was Δ = 10° (vestibular to the right of visual). Plotting conventions are similar to Figure 1, except that red colors represent the visual cue, and blue colors, the vestibular cue. Stimulus schematics (left column) indicate which of the discrepant cues was accurate (lies on vertical dotted line), according to external feedback. Psychometric data (circles, middle column) were fitted with cumulative Gaussian functions, and corresponding probability distributions were generated (right column). Horizontal arrows mark significant shifts of the cues, with the shift size in degrees presented below the arrows on the probability distribution plots. (A) When the more reliable cue was also accurate, only the other (less reliable and inaccurate cue) was calibrated. (B) When accuracy and reliability were dissociated (the less reliable cue was accurate), cue yoking was observed, i.e., both cues shifted together in the same direction. ‘X’ symbols mark shifts of the less reliable cue away from feedback, becoming less accurate.

