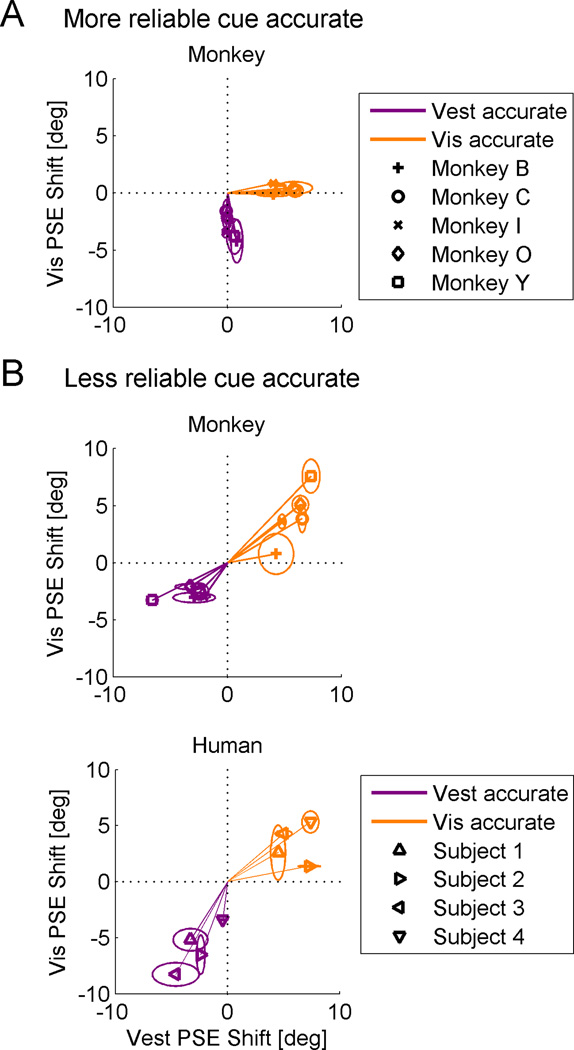
Figure 4. Individual shifts.
Visual versus vestibular PSE shifts were plotted in the different conditions. Data for vestibular-accurate sessions are plotted in purple and data for visual-accurate sessions are plotted in orange. An ellipse around each data-point marks the standard error of the mean (SEM) calculated for each cue, individually. Data are presented in the form of Δ = +10°, but also comprise data collected with Δ = −10°. (A) When the more reliable cue was accurate, the data lie on the axes (dotted lines), indicating that only the inaccurate cue was calibrated. The accurate cue did not shift. (B) When the less reliable cue was accurate, the data lie in the quadrants of positive correlation, demonstrating cue yoking. Cue yoking was demonstrated for both monkeys (top plot, B) and humans (bottom plot, B).

