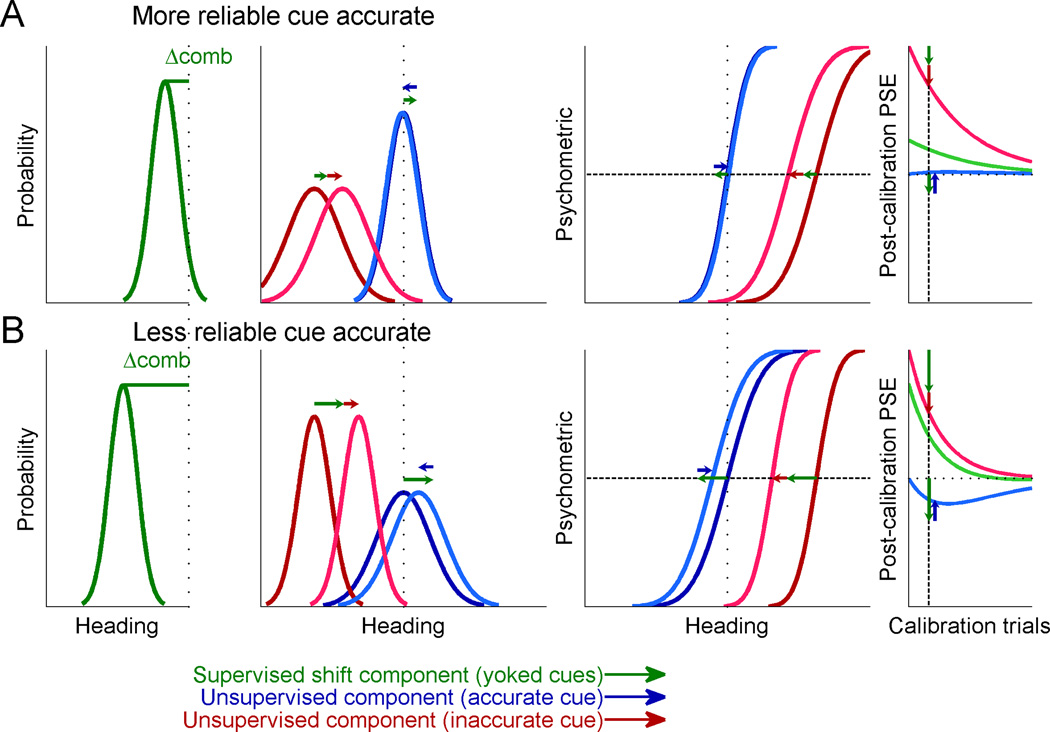
Figure 5. Model 3 simulation.
Two cues for heading direction were generated with a constant heading discrepancy between them, and calibration was simulated according to Model 3. Pre-calibration, one cue was accurate (blue), and the other, biased (red) in relation to external feedback. Psychometric plots and probability density functions were generated similar to Figure 1. But here, post-calibration plots represent partial calibration, as depicted by the vertical dashed lines and arrows in the time-course plots (rightmost column). Green arrows represent the supervised, yoked, component, and blue and red arrows (for the accurate and inaccurate cue, respectively) represent the unsupervised, individual, component. (A) When the accurate cue was also more reliable, the combined cue bias was small (Δcomb; left column) and hence the yoked component was small. In total this resulted in a shift of the inaccurate but not accurate cue. (B) When accuracy and reliability were dissociated, the combined cue bias was large and hence the yoked component was dominant. This resulted in a shift of the accurate cue together with the inaccurate cue.

