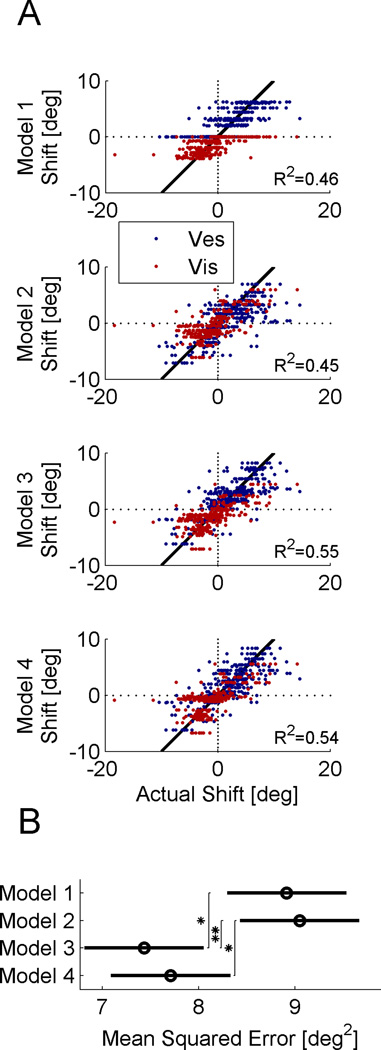
Figure 7. Model fit comparison.
(A) Scatter plots demonstrate the model predicted vs. actual cue shifts (red and blue for visual and vestibular, respectively). The diagonal is marked by a solid black line, and represents a perfect model fit. R2 values indicate the data fit to the diagonal. (B) Circles and horizontal bars mark the mean squared error and the Tukey-Kramer 95% confidence intervals, respectively (‘*’ indicates p<0.05; ‘**’ indicates p<0.01).

