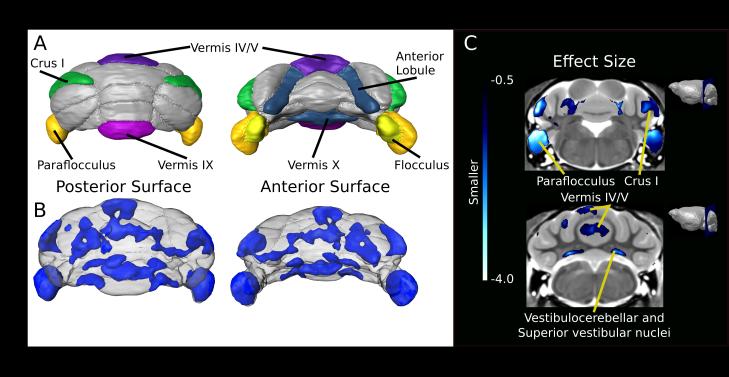
Figure 4.
Cerebellar differences found within the Df16A+/− mice. (A) Schematic surface renderings highlighting regions of interest (ROIs) including the anterior lobule representing the paravermis portions of vermis lobule IV/V, vermis lobules IX/X, crus I, paraflocculus and flocculus. (B) A 3D map of areas with an effect size above 0.5 that survived multiple comparisons using Threshold-free Cluster Enhancement (TFCE) (Smith et al. 2009). (C) Coronal slice of effect size representing smaller volumes within the cerebellum. Visible on the top slice are the anterior portion of lobule IV/V, crus I, paraflocculus and flocculus. The lower slice includes lobule IV/V within the vermis, left simplex lobule, and the superior vestibular and vestibulocerebellar nuclei.

