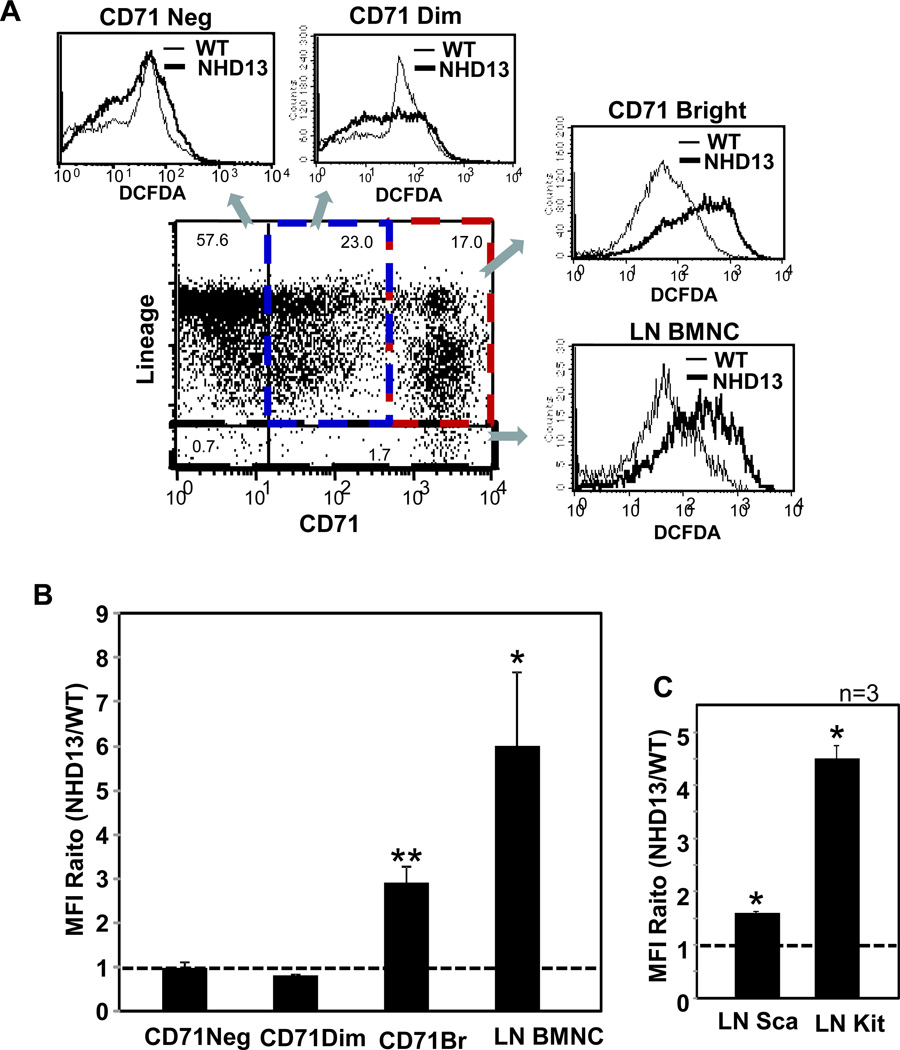
Fig. 1.
Increased ROSs in proliferative cells and primitive hematopoietic progenitor cells of NHD13 mice. (A) Representative FACS profiles showing increased ROS in CD71 positive BMNC and LN BMNC from NHD13 mice. Histograms show DCFDA staining intensity from NHD13 BMNC (thick line) compared to WT littermate control BMNC (thin line). (B) Average mean fluorescence intensity (MFI) ratio of NHD13 versus age matched WT littermates was determined by FACS analysis from 3 independent experiments using CD71 and a lineage cocktail, and 9 independent experiments with lineage depleted cells. (C) MFI of DCFDA was analyzed in Lineage negative (LN) Sca-1 positive cells and LN cKit positive cells from 3 independent experiments. Error bars represent SEM. *, p<0.05; **, p<0.01

