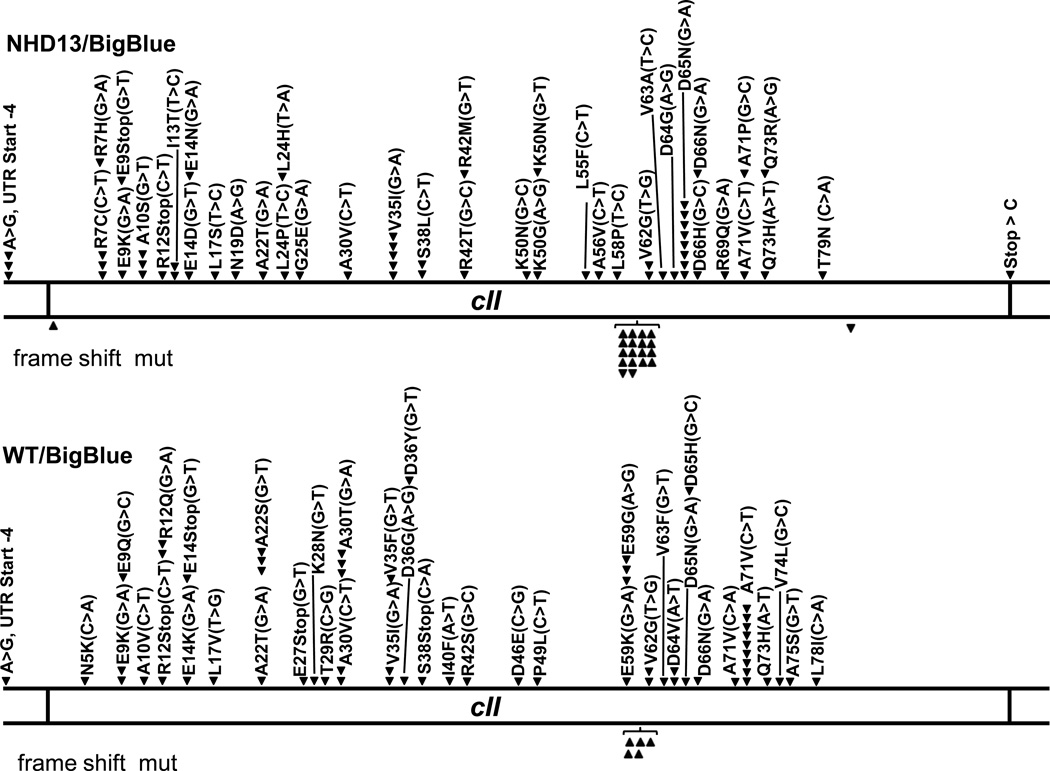
Fig. 5.
λ cII mutational spectra. Linear map of the cII gene. Numerical co-ordinates refer to amino acid (aa) residue. Downward arrowheads above the diagram indicate single nucleotide substitutions. Upward and downward arrows below the diagram indicate single nucleotide frameshift insertions or deletions, respectively. Specific nucleotide changes are indicated in brackets. The mutations marked on the figure represent combined results from 4 independent experiments. UTR, untranslated region.

