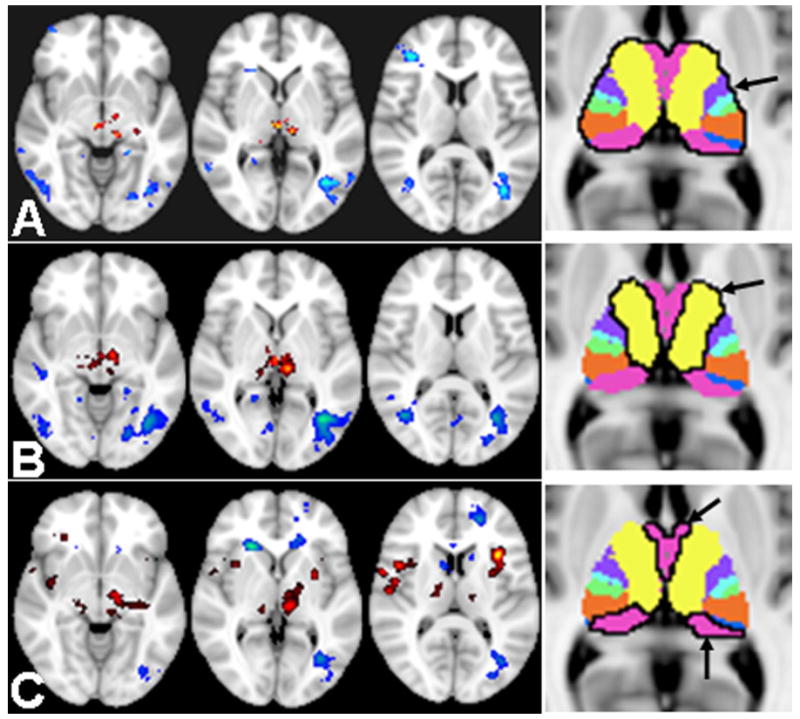
Figure 4.

Based on RS-fMRI, selected slices covering thalamic regions compared fcMRI of MTBI and controls; seeding from bilateral thalamus and its segments (i.e. 4 and 7) marked with black margin on the rightmost images. A: RS-fcMRI seeding from the whole thalamus showed difference between MTBI patients and controls; with decreased thalamo-thalamo connectivity (red color) and mainly increased thalamo-occipital connectivity (blue color) in MTBI patients compared to controls (minimum Z>2.3; cluster significance, P<0.05, corrected; cluster size K≥100) with a 25% gray matter mask from the FSL standard template. B: Thalamic segment 4 fcMRI when seed was put in the sub-segment4 (frontal projections) showed more reduced thalamo-thalamo connectivity in red color comparing patients to controls; and similar increased thalamo-occipital connectivity in blue color. C: RS-fcMRI when seed was put in the sub-segment7 (temporal projections) showed thalamic fcMRI differences between MTBI patients and controls with decreased thalamo-thalamo connectivity (red color) while more increased thalamo-cortical connectivity (occipital and scattered frontal white matter regions) in MTBI patients compared to controls.
