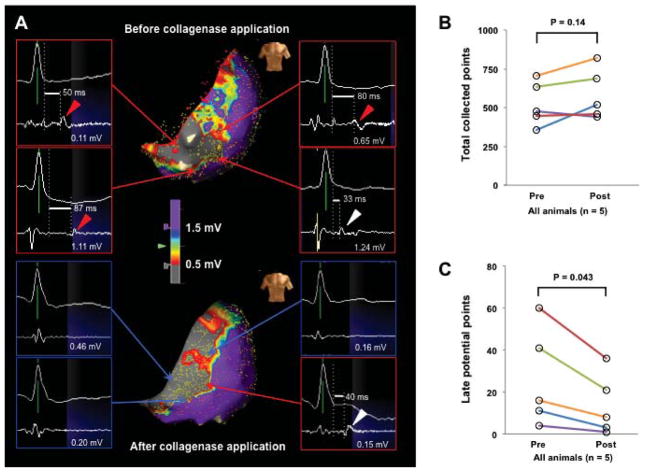
Figure 4.
Collagenase application eliminates late potentials: A, Bipolar voltage map and isolated late potential (LP) distribution before and after collagenase type 4 (CLG-4) application. Red arrows indicate LPs in the scar area, and red arrowheads indicate actual LPs on the electrogram. Blue arrows indicate LP eliminated points. B, Quantification of total collected points from electro-anatomical maps before and after CLG-4 application. C, Quantification of the number of LPs before and after CLG-4 application. The white arrows denote a LP that remained after CLG-4 application.

