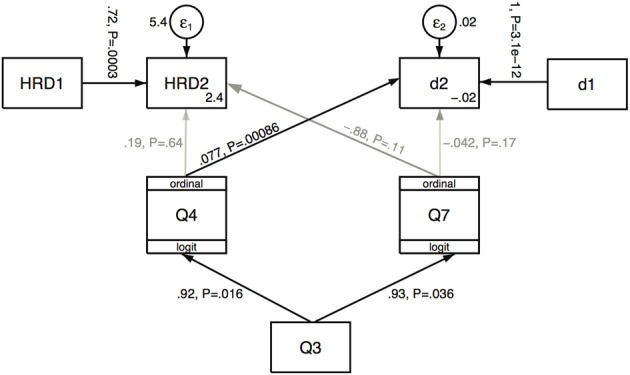
Figure 3.

Path analysis for HRD and distance measures in relation to questionnaire variables Q3, Q4, Q7. The values on the paths are the path coefficients followed by their significance levels. The epsilon terms represent the random error term. The diagram can be interpreted as a set of simultaneous linear prediction equations, e.g., HRD2 = 2.4 + 0.19*Q4 − 0.88*Q7 + 0.72*HRD1 + epsilon. The interpretation of the paths to the ordinal variables (Q4, Q7) is more complex (see main text). The circles are the random error terms and values by the epsilon circles are their variances. The lighter arrows indicate the non-significant paths.
