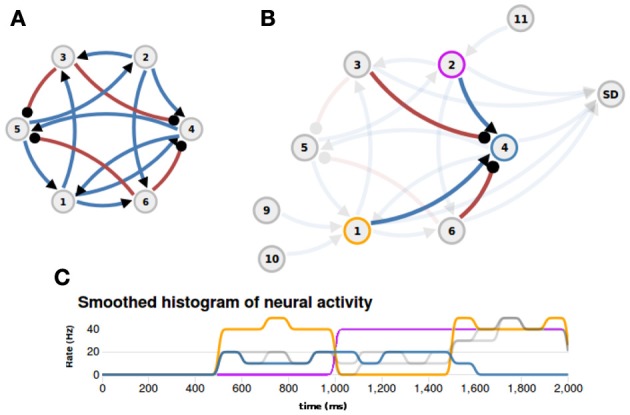
Figure 4.

Example (XOR function). (A) The layout of the network that implements a XOR function (blue: excitatory connections, red: inhibitory connections). (B) Appropriate inputs (500–1000 ms: Poisson input to N1; 1000–1500 ms: Poisson input to N2; 1500–2000 ms: Poisson input to N1 and N2) are provided through nodes N9, N10, and N11, and the spiking activity of neuron N4 is measured with a spike detector (SD). The afferent projections to neuron N4 are highlighted. (C) The histogram of neural activity reveals the XOR-function: the activity of ouput neuron N4 (blue line) is high only if one input neuron, N1 (orange line) or N2 (magenta line), is active and is zero otherwise.
