
Figure 3.
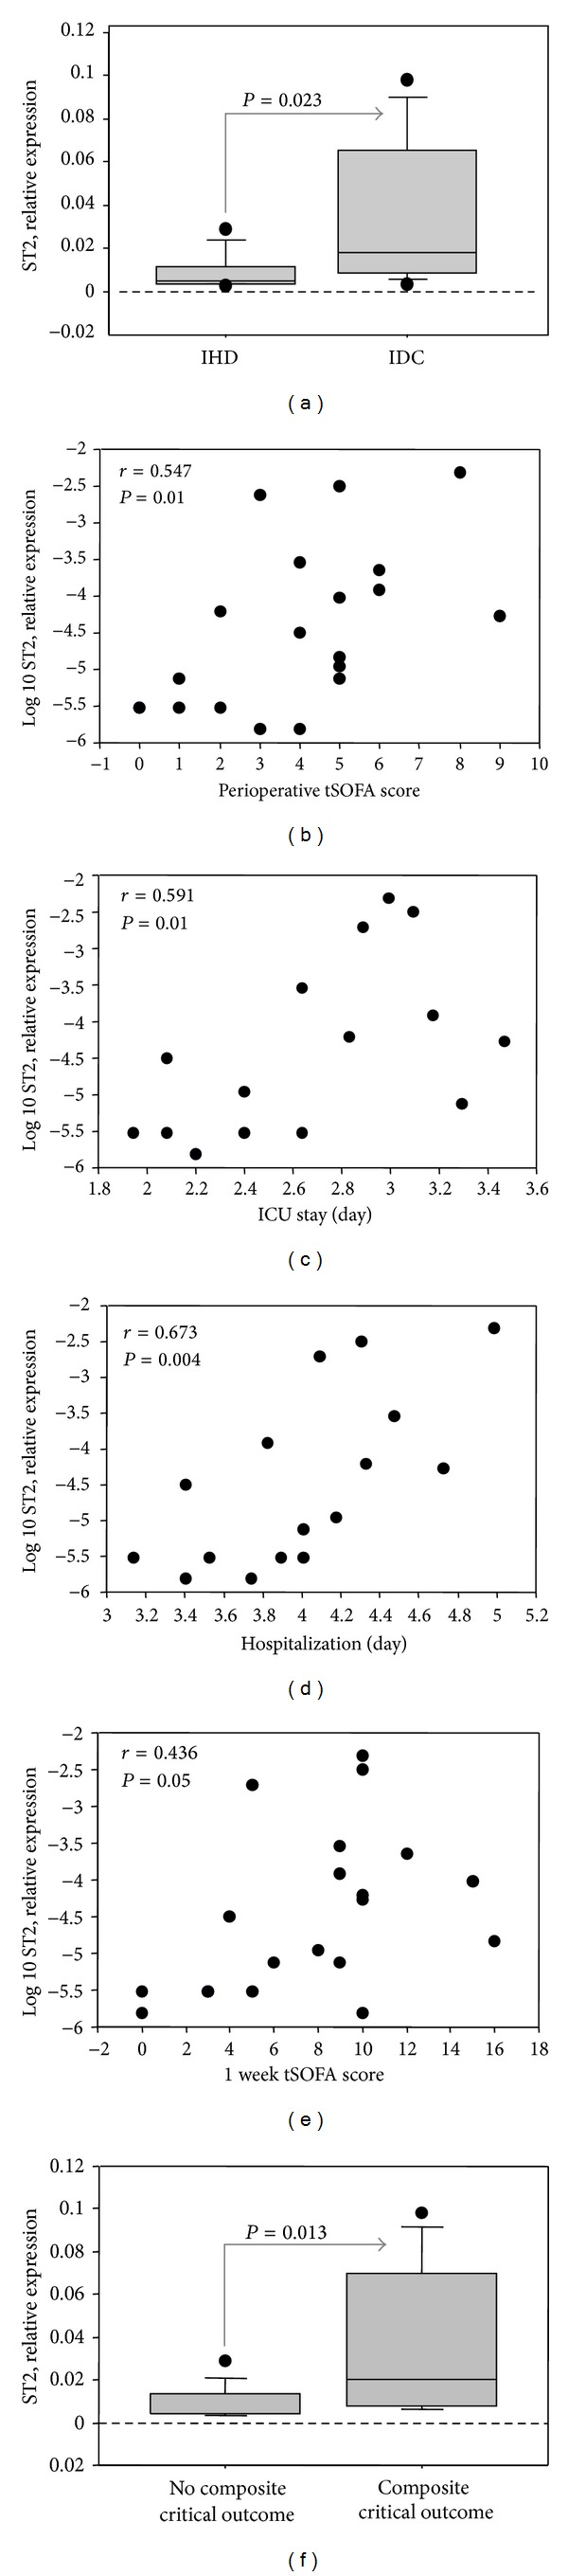
Relation between myocardial ST2 expression and both diagnosis ((a) and (b)) and outcome ((c) and (d)) of pre-LVAD group of samples. (a) Different ST2 expression according to HF etiology; (b) correlation with perioperative tSOFA score; (c) correlation with duration of ICU stay; (d) correlation with length of hospitalization; (e) correlation with 1 week tSOFA score; (f) ST2 expression according to composite outcome.