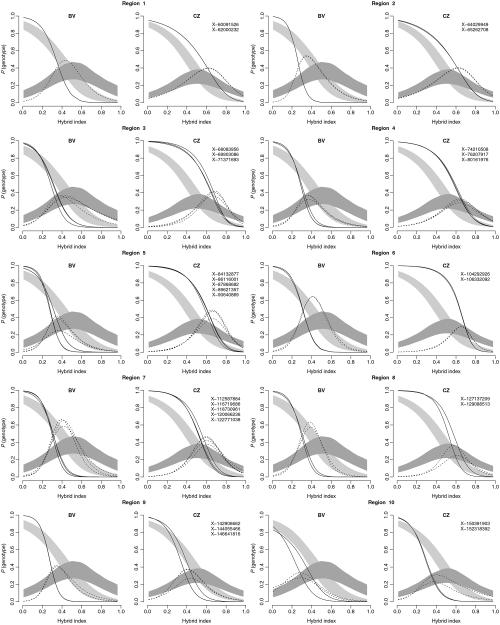
Fig. 4.
Genomic clines for 29 X-linked markers from within the 10 SXURs plotted for each transect separately. Probability of genotype (M. m. domesticus homozygotes—solid line; heterozygotes—dashed line) plotted on hybrid index. Null expectations (light grey: homozygotes for M. m. domesticus alleles; dark grey: heterozygotes) are based on the permutation of autosomal data (1316 markers). Hybrid index used from Wang et al. (2011). Numbers correspond to the SXURs numbers in Fig. 3.

