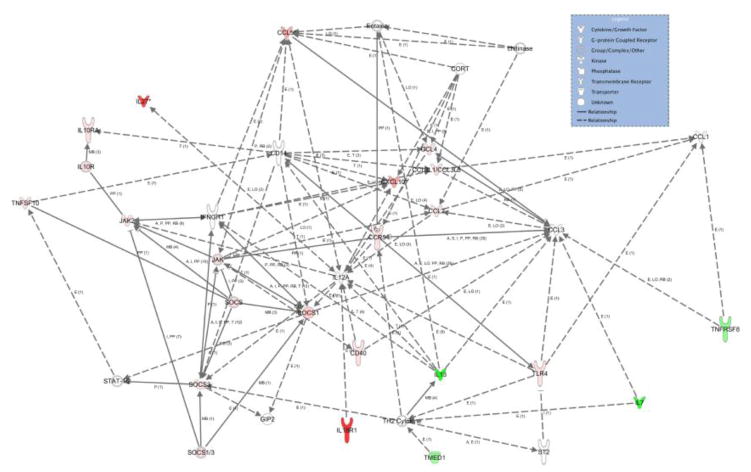
Figure 8.
GM-CSF induces both pro- and anti-inflammatory responses. Shown is a pathway connecting inflammatory and T cell genes that are significantly changed from MPTP-treatment group after either GM-CSF pretreatment or GM-CSF induced Treg adoptive transfer. Genes were submitted to IPA for analyses to evaluate known interactions and are indicated with a connecting line. Red coloration indicates an increase in expression as compared to MPTP control, and green indicates a decrease in expression. Color intensity indicates degree of increase or decrease. Lack of color indicates a molecule involved, but not identified in the data set. Differences in fold change (n = 3 per group) were determined where p < 0.05. The gene interaction network was generated using Ingenuity Pathways Analysis (Winter 2012 release; version 14400082) and the Path Explorer tool.

