
Figure 1.
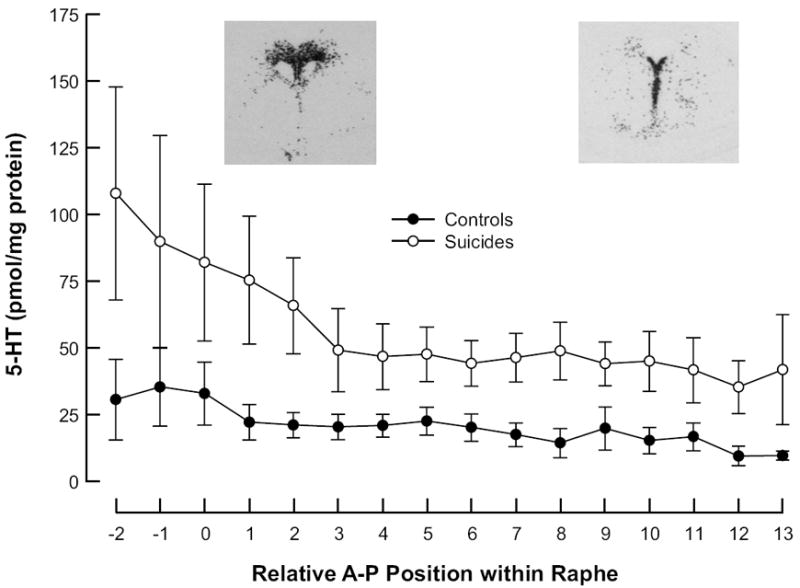
Distribution of 5-HT in the brainstem. Note that suicides (empty circles) have more 5-HT throughout the rostrocaudal extent of the DRN than controls (filled circles). Rostral is to the left, 0mm is the DRN peak area and caudal is to the right; the inserts are corresponding autoradiograms of TPH2 mRNA. These plots include the male subjects only; the 2 control females were excluded from the plot but not the analyses because their values were markedly higher than the males.