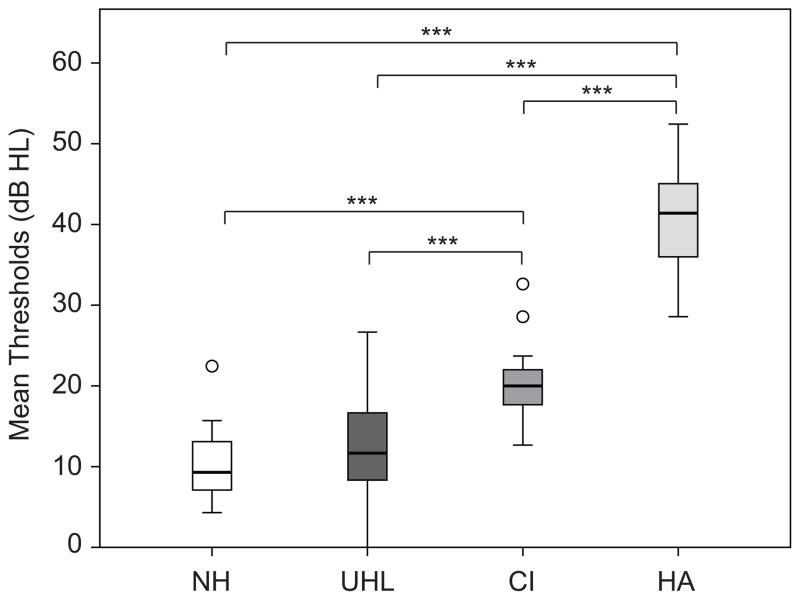
Figure 2.
Box plots show differences in Better Ear Hearing thresholds for normal hearing (NH), unilateral hearing loss (UHL), cochlear implant (CI) and hearing aid (HA) groups. The box depicts the two mid quartiles transected by the median; tails represent the upper and lower quartiles, and outliers are indicated with open circles. Brackets and asterisks denote significance, *** p < 0.001.

