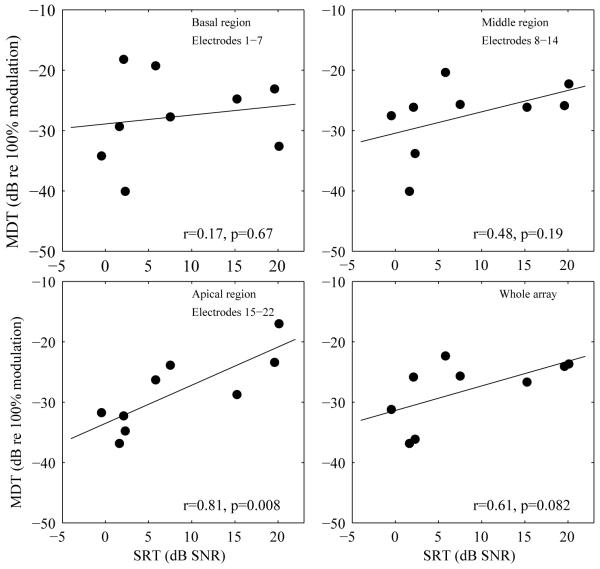
Figure 6.
Correlations between modulation detection thresholds (MDTs) and speech reception thresholds (SRTs). MDTs averaged from three tonotopic locations (electrodes covered in each region are specified in the corresponding panels) and from the whole array were plotted against the subjects’ SRTs. Correlation coefficients and p values are shown in each panel. The lines represent linear fits to the data.

