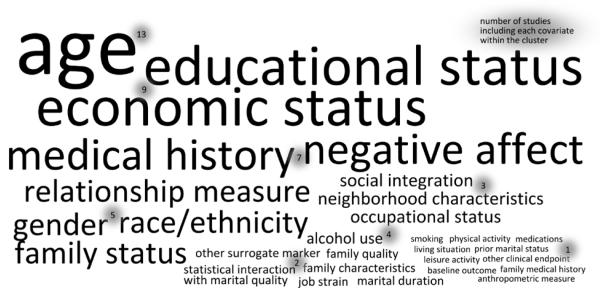
Figure 6.
Word cloud depicting covariate frequencies in studies with both minimal and maximal covariate adjustment. Font size is proportional to the number of studies (out of k = 21) including the covariate in rmax analyses. Numbers indicating the frequency of studies including the covariate are also shown.

