. 2014 Jan 5;24(1):15–24. doi: 10.2188/jea.JE20130051

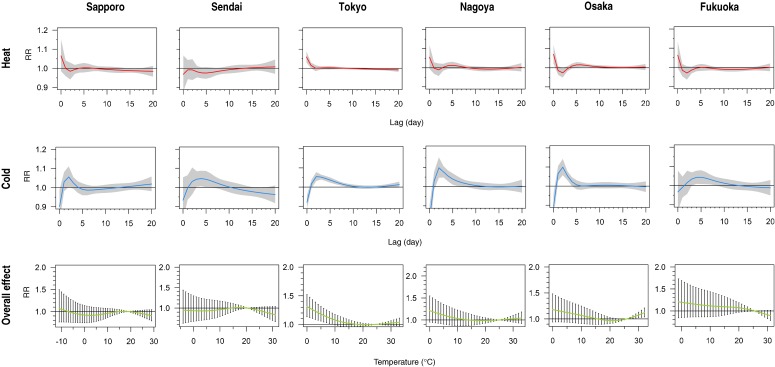
Figure 1. Structure of the delayed effects of heat and cold and the overall effect of temperature on daily mortality, by city. The first and second rows show the relative risks (RRs) of mortality due to heat and cold, from lag 0 to 20. These RR estimates are computed at city-specific maximum (heat) and minimum (cold) temperatures, with the 80th percentile temperature in each city as reference. Shaded regions represent 95% CIs. The third row shows the RR of mortality for the temperature range in each city. The 95% CIs are shown as vertical lines. The degrees of freedom for the natural cubic splines of temperature variable and its lag term are 3 and 5, respectively.

Figure 1.