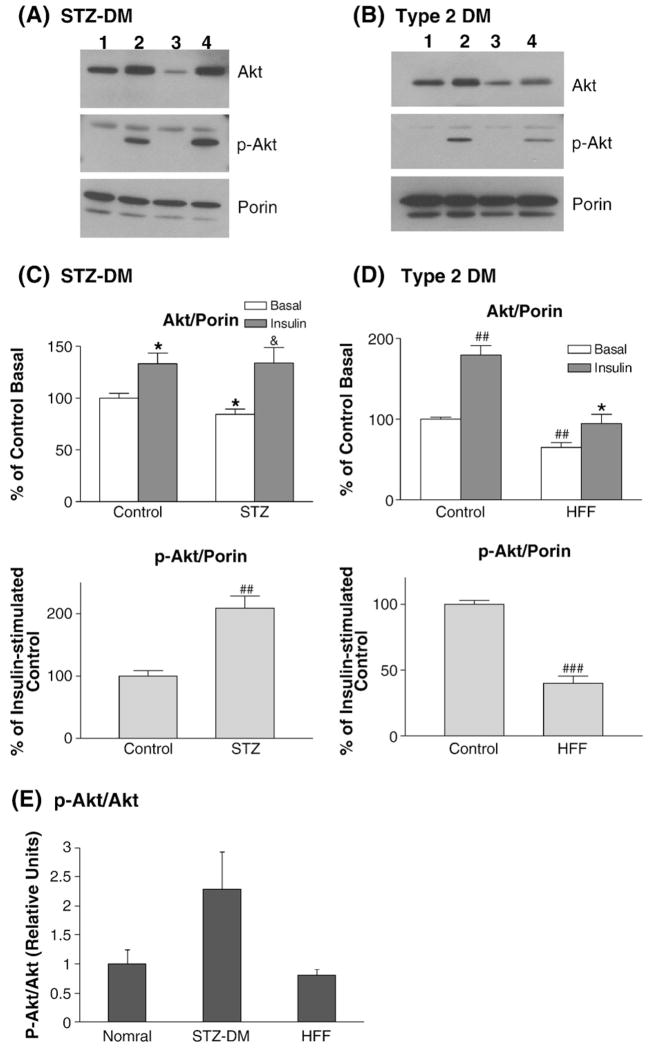
Fig. 6.
Mitochondria translocation of phospho-Akt in insulin-deficient diabetes and diet-induced diabetes. Control and diabetic mice were overnight-fasted and injected with insulin (10 min). STZ-DM was used as insulin-deficient diabetes model (A). Mice fed with high fat-high fructose (HFF) diet were used as Type 2 DM model (B). Proteinase K-treated mitochondria preps were used for western blots to determine Akt translocation. (A) Insulin-stimulated Akt translocation to mitochondria in the myocardium of STZ-DM mice. Lane 1 — control basal, lane 2 — insulin-stimulated control, lane 3 — STZ-DM basal, lane 4 — insulin-stimulated STZ-DM. In the phospho-Akt blot, the lower band represents p-Akt and the upper band is a non-specific band. (B) Insulin-stimulated Akt translocation to mitochondria in the HFF myocardium. Equal protein amount of proteinase K-treated mitochondria prep was used in each lane. Lane 1 — control basal, lane 2 — insulin-stimulated control, lane 3 — HFF-DM basal, lane 4 — insulin-stimulated HFF-DM. In the phospho-Akt blot, the lower band represents p-Akt and the upper band is a non-specific band. (C) Phospho-Akt translocation was enhanced in the STZ-DM myocardium. Equal protein amount of proteinase K-treated mitochondria prep was used in each lane. The bar graphs represent the data summarized from multiple experiments, these data were normalized to the contents of porin in each prep. The lower graph compared the magnitude of insulin-stimulated translocation between the control and STZ-DM myocardium. *p<0.05 vs. control basal; &p<0.05 vs. DM basal; ##p<0.001 vs. insulin-stimulated control. (D) Phospho-Akt translocation was reduced in the HFF-DM myocardium. The bar graphs represent the data summarized from multiple experiments, these data were normalized to the content of porin in each prep. The lower graph compared the magnitude of insulin-stimulated translocation between the control and HFF-DM. ##p<0.001 vs. control basal, *p<0.05 vs. HFF basal, ###p<0.00001 vs. insulin-stimulated control. (E) Stoichiometry of Akt phosphorylation in diabetic myocardium. The ratios of Akt phosphorylation to Akt protein abundance were calculated in the normal, STZ-DM, and HFF-DM mice injected with insulin. Equal amounts of myocardial mitochondria proteins were respectively immunoblotted with anti-p-Akt and anti-Akt antibodies and the relative ratios of p-Akt to Akt were calculated.

