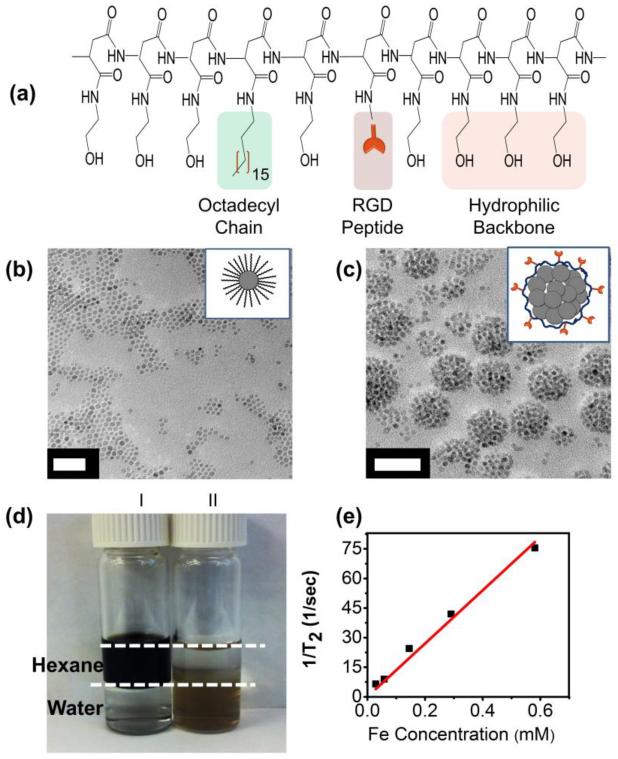
Figure 1.
Characterization of RGD-PHEA-g-C18 and RGD-SPIO cluster. (a) Structure of RGD-PHEA-g-C18. (b) TEM image of oleic acid-coated SPIOs. (c) TEM image of RGD-SPIO clusters. Both scale bars represent 50 nm. (d) OA-coated SPIOs (I) are suspended in hexane, while RGD-SPIO clusters (II) are dispersed in water. Dotted white lines help indicate the interface between hexane and water. (e) A plot of 1/T2 vs. iron concentration used to determine T2 relaxivity of RGD-SPIO clusters.

