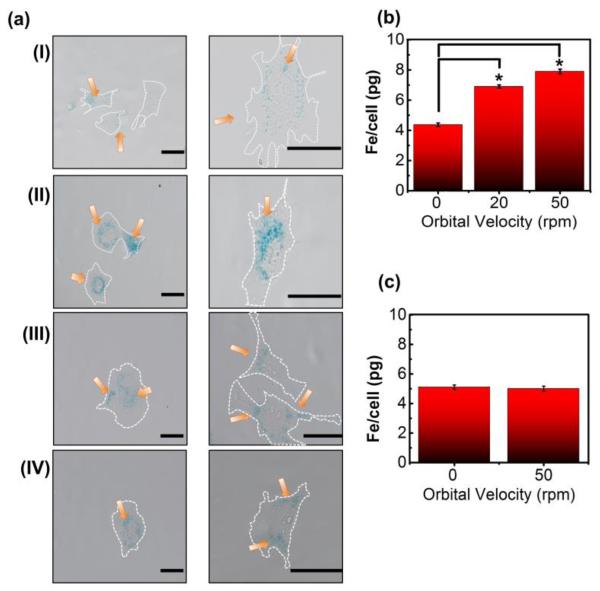
Figure 2.
Analysis of the effect of orbital velocity on cellular uptake of RGD-SPIO clusters at varied FBS concentrations (ΦFBS). (a) Phase contrast images of BMSCs labeled at various conditions. Prussian blue stain indicates the presence of iron. (a-I) BMSCs labeled with RGD-SPIO clusters under static conditions (ΦFBS = 10 %), (a-II) BMSCs labeled with RGD-SPIO clusters at 50 rpm (ΦFBS = 10 %), (a-III) BMSCs labeled with RGD-SPIO clusters under static conditions (ΦFBS = 1 %), (a-IV) BMSCs labeled with RGD-SPIO clusters at 50 rpm (ΦFBS = 1 %). Scale bars represent 40 μm. The images on the 2nd column in (a) are magnified images of cells from the same condition in the 1st column. Orange arrows indicate RGD-SPIO clusters stained by Prussian blue, and white dotted lines indicate cellular periphery. (b) ICP analysis to quantify the dependence of the iron content per cell on orbital velocity at ΦFBS of 10 %. Differences of values between conditions were statistically significant (*p < 0.05). (c) ICP analysis to show the independence of the iron content per cell on orbital velocity at ΦFBS of 1 %.

