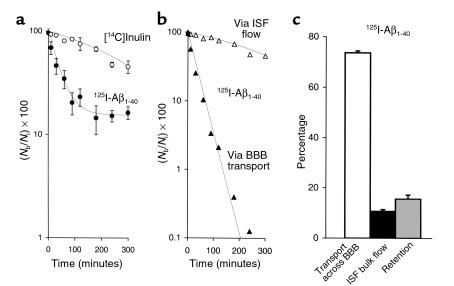
Figure 1.
(a) Time-disappearance curves of [14C]inulin (open circles) and 125I-Aβ1-40 (60 nM; TCA-precipitable 125I radioactivity, filled circles) from the CNS after simultaneous microinjections of tracers into the caudate nucleus in mice. Each point represents the mean ± SD of three to seven animals. (b) Two components of 125I-Aβ1-40 efflux, vascular transport across the BBB (filled triangles) and transport via ISF bulk flow (open triangles), were computed with equations 3 and 4 using data from a. (c) Relative contributions to Aβ1-40 efflux by its transport across the BBB (open bar), diffusion via ISF bulk flow (filled bar), and retention (gray bar) in the brain were studied at 60 nM concentrations and calculated from the fractional coefficients given in Table 1.

