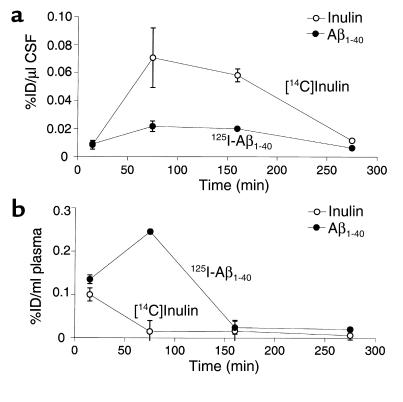
Figure 2.
Time-appearance curves of [14C]inulin (open circles) and 125I-Aβ1-40 (60 nM; TCA-precipitable 125I radioactivity, filled circles) in the CSF (a) and plasma (b) after simultaneous microinjections of tracers into the caudate nucleus in mice. Values are expressed as percentages of injected dose (%ID); each point is mean ± SD of three to seven animals.

