
Chart 1.
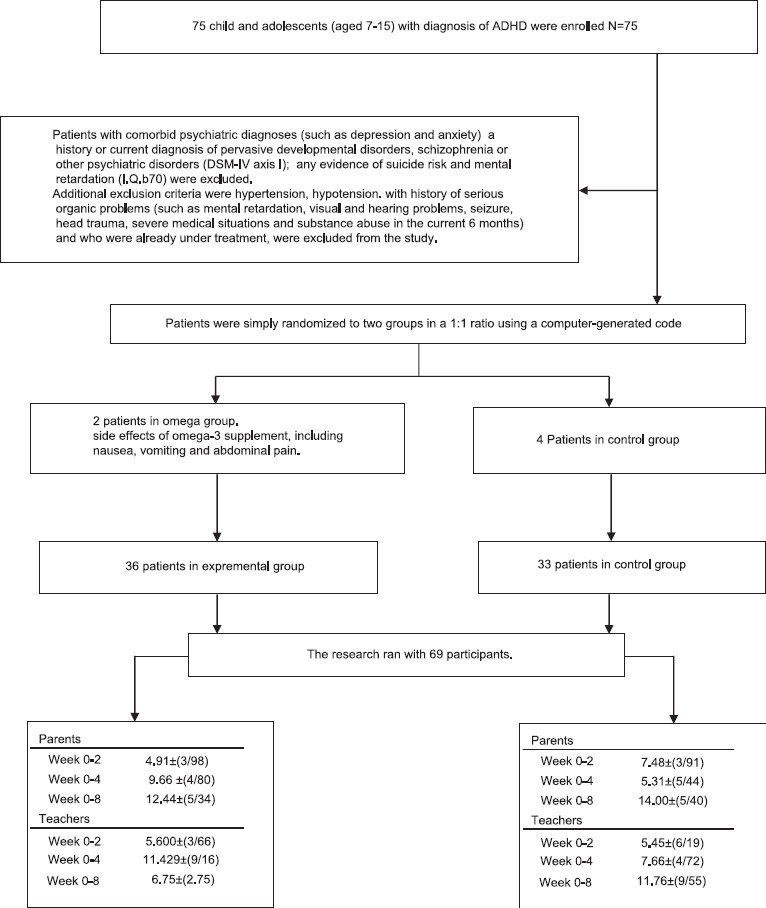
flow chart study. Presents the numbers of participants who were randomly assigned, received omega3 or placebo, and were analysed for the primary outcome
Official websites use .gov
A
.gov website belongs to an official
government organization in the United States.
Secure .gov websites use HTTPS
A lock (
) or https:// means you've safely
connected to the .gov website. Share sensitive
information only on official, secure websites.
flow chart study. Presents the numbers of participants who were randomly assigned, received omega3 or placebo, and were analysed for the primary outcome