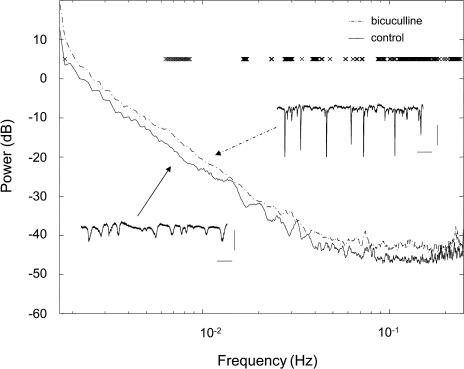
Figure 3. Frequency Domain Analysis of Population Dynamics of Fluorescence in Astrocytes in Control State and during Bicuculline-Induced Neuronal Hyperactivity.
Insets show local field potentials in a control animal and regular spiking in a bicuculline treated mouse (scale bar: 2.0 s, 500 μV). Asterisks show significant differences (p < 0.05) between groups at various frequencies.

