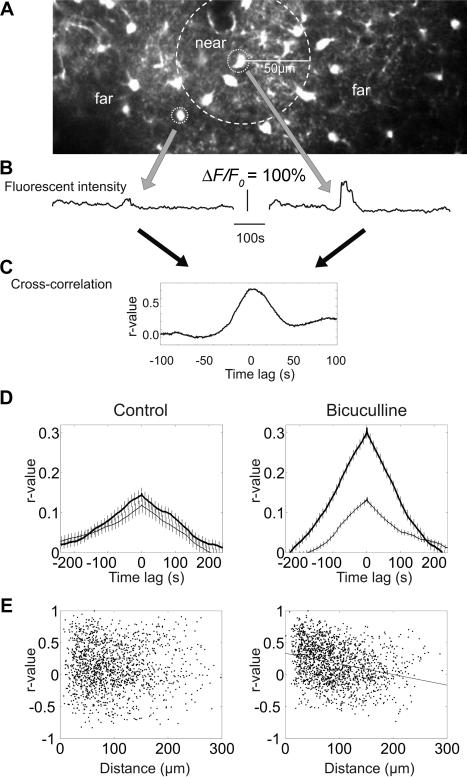
Figure 4. Spatio-Temporal Dynamics of Astrocyte Ca2+ Activity.
(A) Definition of nearby (less than 50 μm) and distant (greater than 50 μm) cell pairs.
(B) Fluorescence changes in two nearby astrocytes.
(C) Cross-correlogram of fluorescent intensity.
(D) Mean cross-correlation of ΔF/F0 in all nearby (thick line) and distant (thin line) cell pairs in control condition (left) and in the presence of bicuculline (right). Note large increase of ΔF/F0 correlation in nearby cell pairs in the bicuculline condition (error bar: standard error of the mean).
(E) Relationship between distance of the two cells and the magnitude of correlation at zero timelag. Note lack of a reliable relationship in the control condition (left). Note also the significant negative correlation between the distance and correlated ΔF/F0 changes in cell pairs in the bicuculline-treated cortex (right).

