
Fig. 3.
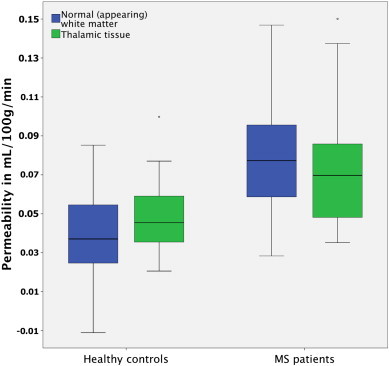
Permeability of the blood–brain barrier showing significantly higher values both in MS periventricular NAWM compared to cerebral white matter of healthy controls (p = 0.9 × 10− 5; one-tailed T test), and in thalamic gray matter (p = 0.003; one-tailed T test). Black line = median. Boxes = 25% and 75% percentiles. Whiskers = sample range, outliers marked by circles. NB! All outliers were included in statistical analysis.