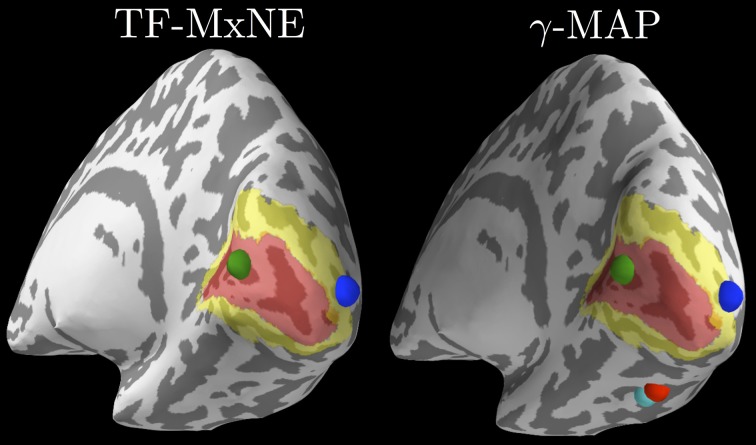
Figure 10.
Source localization with non-linear sparse solvers. The left plot shows results from TF-MxNE on raw unfiltered data (due to the built-in temporal smoothing), and the right plot shows results from γ-MAP on the same data but filtered below 40 Hz. One can observe the agreement between both methods on the sources in the primary (red) and secondary (yellow) visual cortices delineated by FreeSurfer using an atlas. The γ-MAP identifies two additional sources in the right fusiform gyrus along the visual ventral stream. These sources that would not be naturally expected from such simple visual stimuli are weak and peak later in time, which makes them nevertheless plausible.

