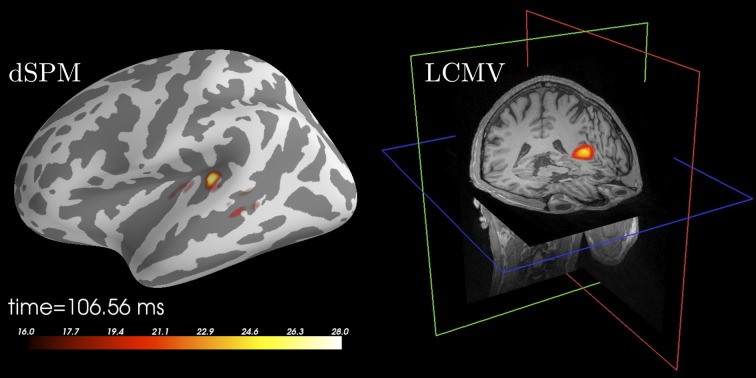
Figure 4.
Source localization of an auditory N100 component. Left: Results obtained using dSPM and a surface source space based on combined MEG and EEG data. The figure was generated using the plot method of the SourceEstimate class which internally calls PySurfer. Right: Results obtained using LCMV beamformer and a volume source space based on MEG channels only. The figure was generated using Freeview shipped with FreeSurfer.

