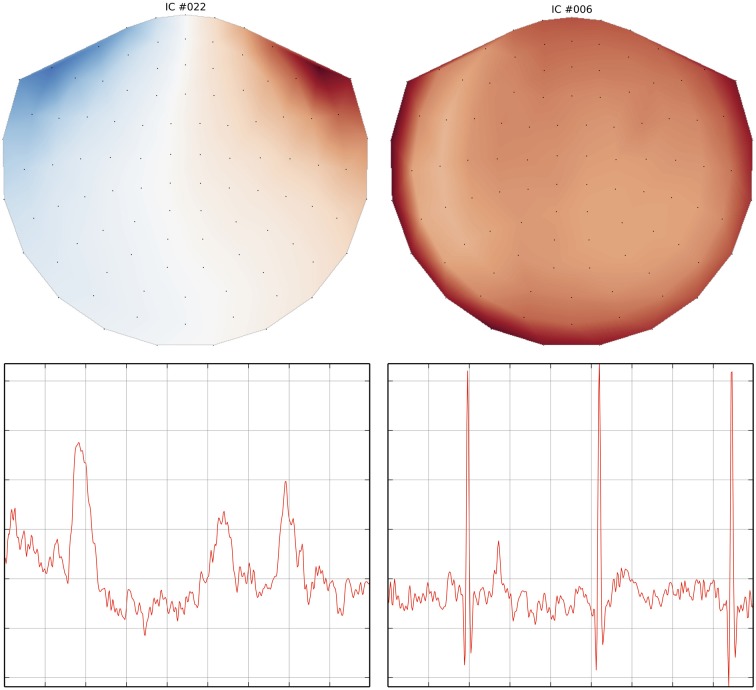
Figure 6.
Topographic and trellis plots of two automatically identified ICA components. The component #22 corresponds to the EOG artifact with a topography on the magnetometers showing frontal signals and a waveform typical of an eye blink. The component #6 on the right captures the ECG artifact with a waveform matching 3 heart beats.

