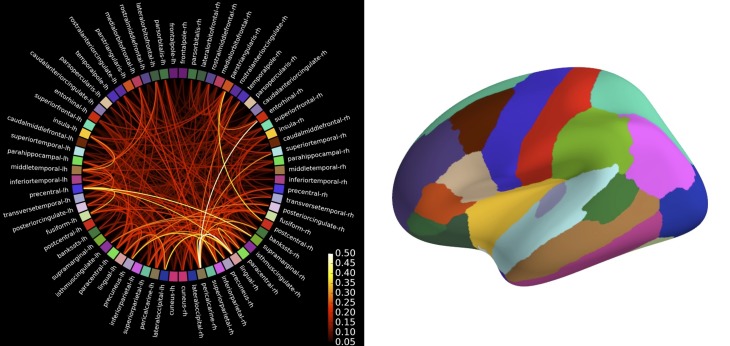
Figure 9.
Connectivity between brain regions of interests, also called labels, extracted from the automatic FreeSurfer parcellation visualized using plot_connectivity_circle. The image of the right presents these labels on the inflated cortical surface. The colors are in agreement between both figures. Left image was produced with matplotlib and right image with PySurfer.

