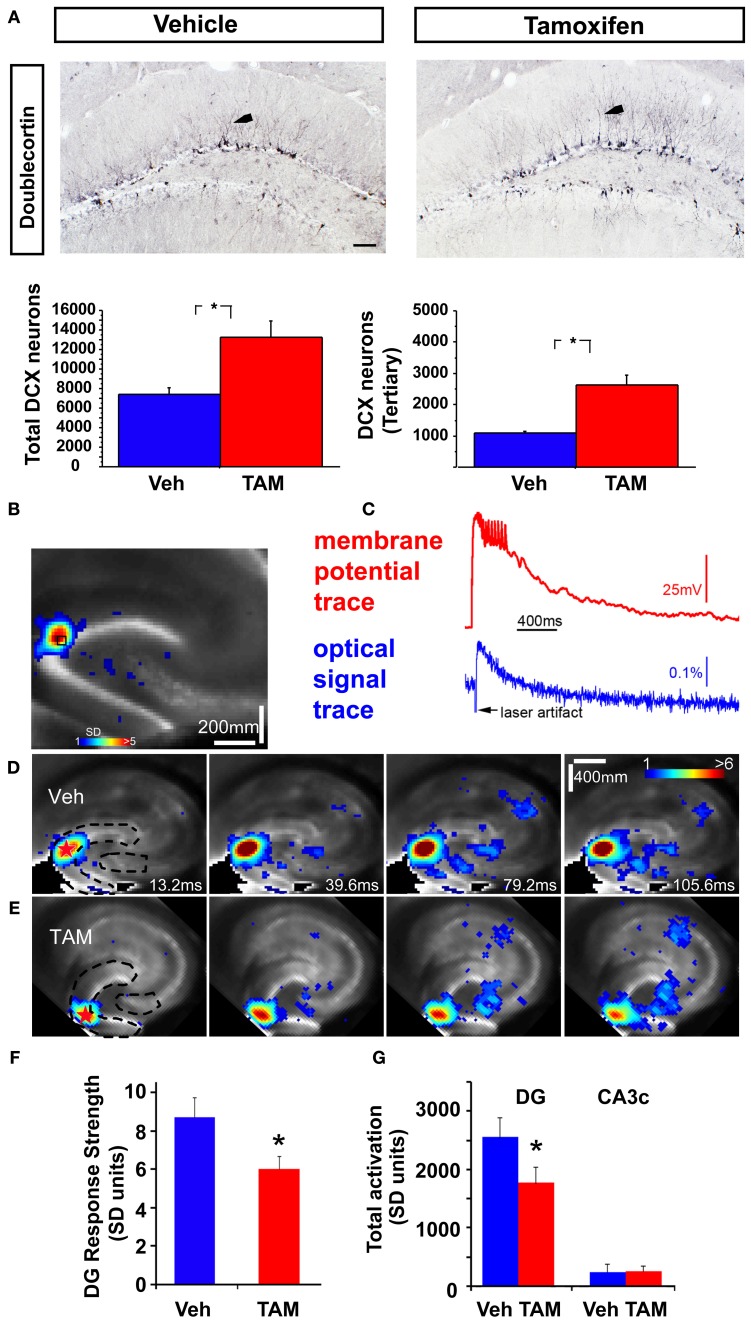
Figure 1.
Increasing adult hippocampal neurogenesis decreases photostimulation evoked DG excitability without affecting CA3c activation. (A) Representative DCX immunostained coronal hippocampal sections of Veh and TAM treated NCff mice. Arrows in insets indicate DCX neurons with at least tertiary dendrites. Quantification of DCX population. Total DCX+ neurons: Veh: 7435.5 ± 629.2, TAM: 13228.5 ± 1720.2, Mean ± SEM, p = 0.0195, n = 4/gp, DCX expressing neurons with tertiary dendrites: Veh: 1089.0 ± 55, TAM: 2623.5 ± 309.2, Mean ± SEM, p = 0.0027, n = 4/gp. Scale bar: 100 μm. (B,C) VSD imaging and simultaneous whole cell recording indicate that photostimulation evoked VSD signals are closely related to membrane potential depolarization of individual neurons. The measurements are taken from a DG site of a wild type C57BL/6J mouse slice, as indicated by the small black square, in response to spatially restricted photostimulation. The photostimulation locations are labeled with red stars. The VSD image frame in (B) is plotted beginning at the peak membrane depolarization of the recorded neuron. Color-coded activity is superimposed on the background slice image. The color scale codes VSD signal amplitude expressed as SD (standard deviation) multiples above the mean baseline. Warmer colors indicate greater excitation. (C) Shows the aligned optical signal trace [VSD signal in the percent change of pixel intensity (ΔI/I%)] and current-clamp recording trace. (D,E) Time series data of VSD imaging of photostimulation-evoked circuit activity in example slices from Veh and TAM treated NCff mice, respectively. The stimulation site in DG is indicated by a red star; the image frames are labeled with the specified times after the stimulation onset. Dashed lines in first panels of (D,E) indicate delineated regions for measurement of VSD activity. (F) Average DG response strength at the photostimulation sites between Vehicle and TAM treated NCff mice (n = 7 mice per group). Overall mean: Veh: 8.72 ± 1.01, n = 7 slices, TAM: 5.98 ± 0.70 (mean ± SE SD units), n = 8 slices, p < 0.05. (G) DG activation and output response. Total DG responses (summed amplitudes of activated pixels across 10 peak response frames): Veh: 2552 ± 346 and TAM, 1766 ± 279.2, n = 7 slices each, p < 0.05, (mean ± SE SD units). The proximal CA3 (CA3c) activation followed with DG photostimulation did not differ between the groups. Total response values: Veh: 257.5 ± 94.7 and TAM: 235.8 ± 138.6 (mean ± SE SD units). *p < 0.05.

