Figure 2.
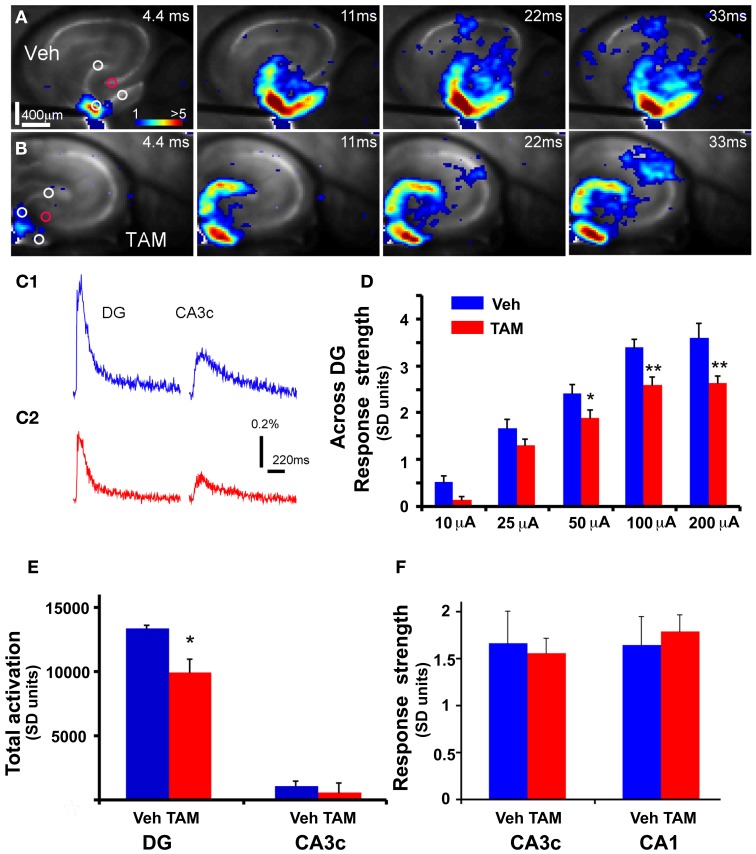
DG of iBaxnestin mice shows decreased strength of neuronal activation following electrical stimulation. (A) Time series data of VSD imaging of hippocampal circuit activity in response to electrical stimulation (100 μA, 1 ms) at DG with a bipolar extracellular stimulation electrode in a Vehicle treated NCff mouse slice. The color scale codes VSD signal amplitude expressed as SD multiples above the mean baseline. Warmer colors indicate stronger excitatory responses. (B) Time series data of VSD imaging of the circuit activity in response to DG electrical stimulation (100 μA, 1 ms) in a TAM treated NCff mouse slice. (C1) The time courses of VSD signal [in the percent change of pixel intensity (ΔI/I%)] from the regions indicated by the small circles in the first frame in DG apex and CA3c of (A), respectively. (C2) The time courses of VSD signal from the small regions indicated in the first frame in DG apex and CA3c of (B). (D) Comparisons of the average VSD response strength across DG (measured from 3 regions indicated by the three white circles at the DG granule cell layer) to electrical stimulation in the DG center of different amplitudes for the control and experimental groups. The data points (mean ± SE) are from 7 mice (22–26 slices total) each group, calculated for each slice and averaged for each animal. Because of slice conditions, responses for all stimulation intensities were not obtained from all slices. Two-Way repeated measures ANOVA, (treatment) F(1, 4) = 10.5, p = 0.03. *p ≤ 0.05, **p ≤ 0.01. (E) VSD response strength of CA3c (delineated by red circle) to DG electric stimulation (100 μA) between Vehicle and TAM treated NCff mice. (F) Total DG and CA3c activation (summed amplitudes of activated pixels across 10 peak response frames) in response to DG electric stimulation (100 μA) between Vehicle and TAM treated NCff mice.

