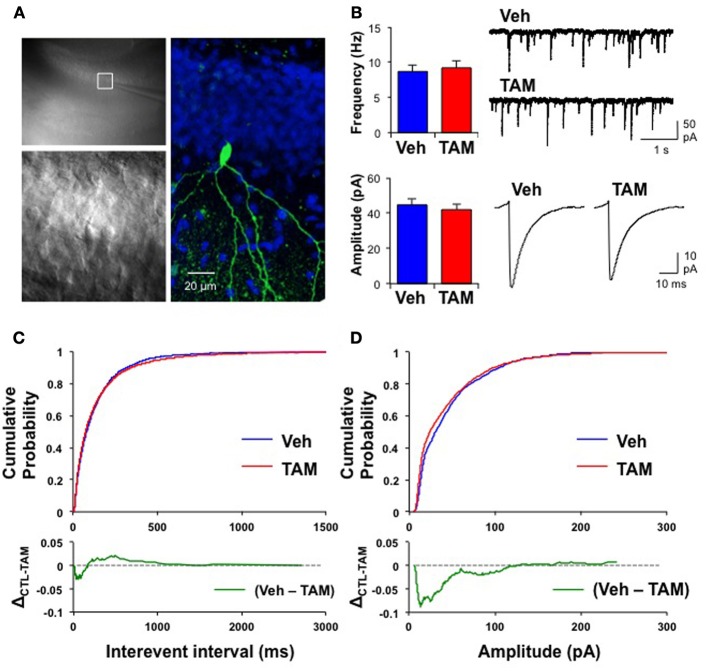
Figure 5.
Mature dentate granule neurons in iBaxnestin mice show redistribution of inhibitory synaptic weights without changes in pattern of mIPSC generation. (A) Recording from a representative mature dentate granule cell. Left, top: A low magnification image showing a patch electrode on a neuron located in the outer blade. The area outlined by the white square is shown below in higher magnification. Right: The same neuron processed for biocytin, which was placed inside the recording pipette. Green: biocytin, Blue: DAPI. (B) No significant difference in the average mIPSC frequency (top left, Veh: 8.7 ± 0.89 Hz; TAM: 9.2 ± 1.03 Hz; t-test: p = 0.71) and the average mIPSC amplitude (bottom left, Veh: 45 ± 3.3 pA, n = 11; TAM: 42 ± 3.2 pA, n = 20; t-test: p = 0.57) between control and iBaxnestin mice. Top right: Representative mIPSC traces. Bottom right: Average mIPSC traces. There was no difference in the kinetics of the mIPSCs between the two groups (10–90 rise: Veh: 1.9 ± 0.07 ms; TAM: 1.9 ± 0.05 ms, p = 0.85; decay time constant: Veh: 6.1 ± 0.45 ms; TAM: 6.5 ± 0.28 ms, p = 0.41). (C) No change in pattern of mIPSC generation between two groups. Top: Cumulative probability of mIPSC interevent intervals from control and iBaxnestin mice. No significant difference between the two groups (Kolmogorov-Smirnov test: p = 0.1). Bottom: Subtraction of the two cumulative probability graphs (Veh–TAM) confirms a minimal change in the distribution of mIPSCs interevent intervals. (D) Changes in the distribution of inhibitory synaptic weight in iBaxnestin mice Top: Cumulative probability of mIPSC amplitudes from control and iBaxnestin mice. There was a significant difference between the two groups (Kolmogorov-Smirnov test: p < 0.001). Bottom: Subtraction of the two cumulative probability graphs (Veh–TAM) reveals a significant increase in the fraction of smaller and larger mIPSCs in the TAM treated group.

