
Table 4. Comparison of the Different Methods on Our Simulated Data.
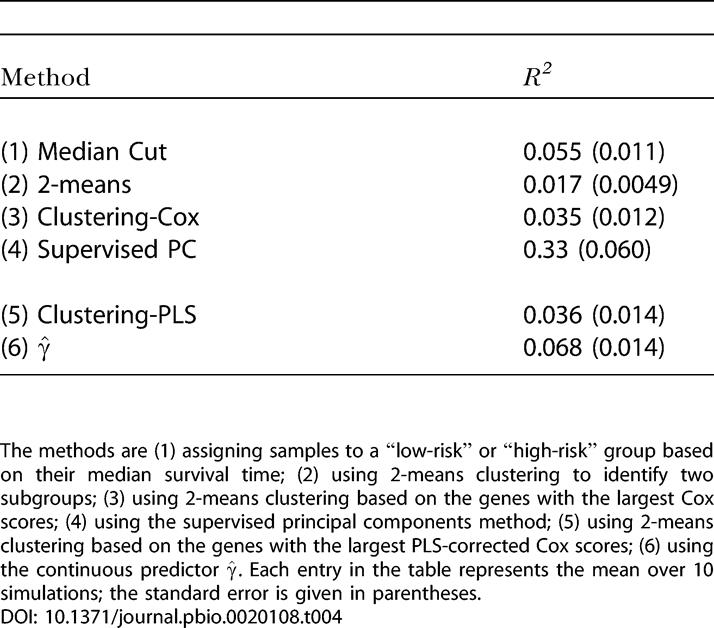
The methods are (1) assigning samples to a “low-risk” or “high-risk” group based on their median survival time; (2) using 2-means clustering to identify two subgroups; (3) using 2-means clustering based on the genes with the largest Cox scores; (4) using the supervised principal components method; (5) using 2-means clustering based on the genes with the largest PLS-corrected Cox scores; (6) using the continuous predictor . Each entry in the table represents the mean over 10 simulations; the standard error is given in parentheses