
Figure 3. Examples of PE T, CO2 and PE T, O2 control in a subject using an SGD breathing circuit and prospective end-tidal targeting.
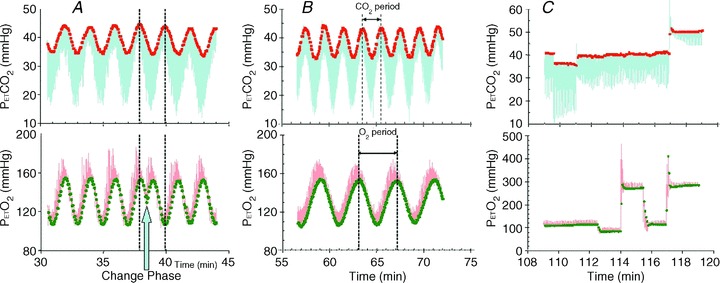
The continuous traces from sampling at the mask are  (blue upper) and
  (red lower). End-tidal values are
  (red filled squares) and
  (green filled circles), each representing a single breath. A, sinusoidal changes of
  and
and  are implemented in phase until the blue arrow, when the phase of the
  is changed 180 deg. B, sinusoidal changes of
  and
and  are implemented with the period of
  twice that of
  . C, simultaneous square wave changes in
  and
and  are implemented independently of each other. In the sinusoidal patterns, the target
  and
and  change with each breath. The algorithm used to reach these targets is context sensitive, that is, it takes into account the current gas concentrations in the lung as well as the target history. This means that the set of flows and inspired gas concentrations differ – even for the same recurrent end-tidal target values, whether they be in a sinusoidal sequence or steady target level. The algorithm uses the baseline
  , and resting CO2 production and O2 consumption to calculate inspired gas parameters. Baseline
  is based on the
  during rest. Resting CO2 production and O2 consumption are calculated from a nomogram based on sex, height and weight. Errors in presumption of CO2 production or O2 consumption, or changes in these due to changes in activity or muscle tone, result in target values drifting over time, as can be seen in A and C.