
Figure 4. Voxel tracking of PE T, CO2.
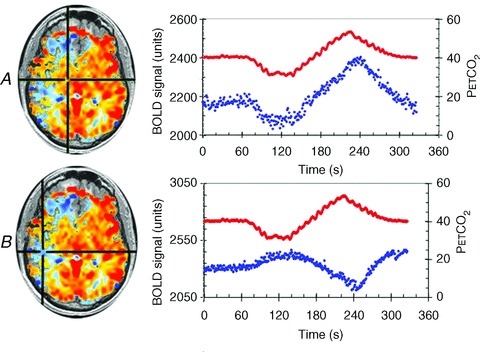
CVR maps, constructed as for Fig. 1, are shown on the left with chosen voxels indicated by the cross-hairs. The right side shows graphs of the time course of the chosen voxels BOLD signals (blue dots) in response to the changes in  (red dots). A, a voxel with positive CVR. B, a voxel with negative CVR (vascular steal). In each case the BOLD signals track the
  stimulus, indicating that a precise and accurate measurement of CVR requires accuracy and precision of the
  stimulus as well as the surrogate measure of cerebral blood flow.