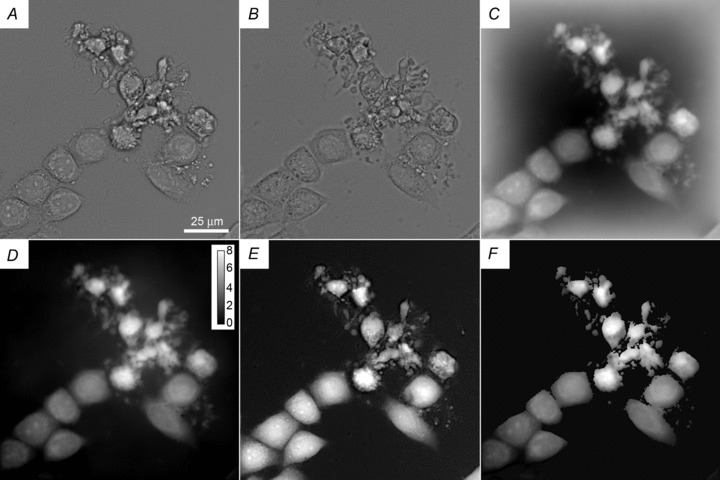
Figure 1. Example of image processing.

A and B, two brightfield images of ActD-treated HeLa cells taken at a 1 μm vertical separation. C, phase image computed from images A and B. D, result of background correction on image C based on two flat images, as described in the text with a bar showing the scale in radians. E, TTD image representing cell thickness. F, a map of n obtained by dividing D by E and masking out the background areas; this image is only semi-quantitative because the background correction in D is not perfect.
