
Figure 2. Background channel activity in cell-attached Task-1−/− and Task-3−/− patches.
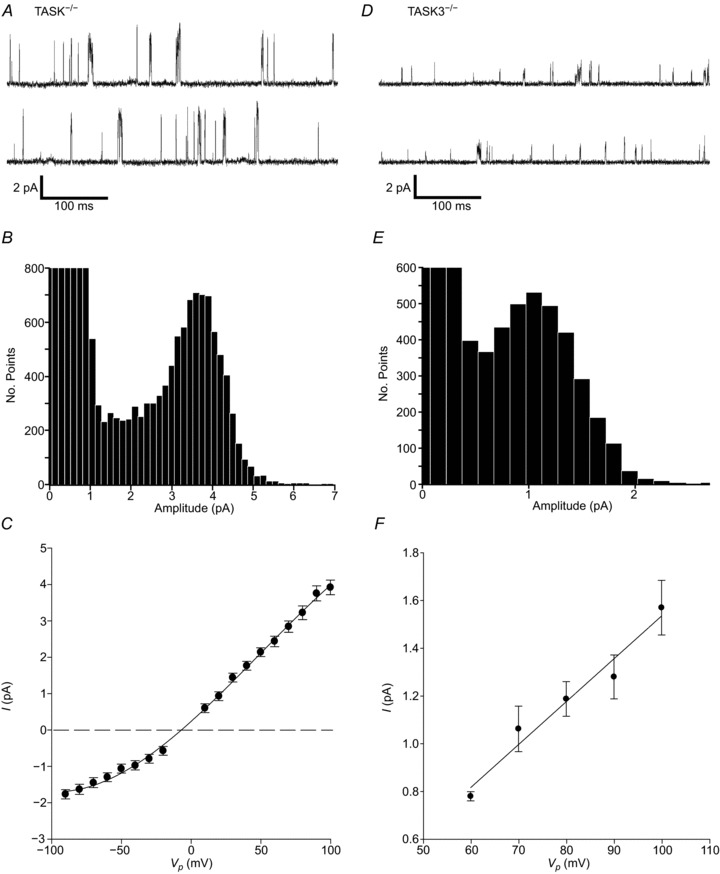
A, D, cell-attached recording of background channel activity from Task-1−/− and Task-3−/− type-1 cells respectively, each showing two contiguous 500 ms sections of recording. Recording conditions were as described for wild-type, type-1 cells. B, E, all-points histograms generated from 20 s and 40 s segments of cell-attached recordings for Task-1−/− and Task-3−/− type-1 cells, respectively. Bin widths were 150 fA. C, mean current–voltage (I–V) relationship for background channel activity in Task-1−/− type-1 cells (n= 13 for most points). Data for inward and outward currents were fitted independently by least squares linear regression and yielded a mean ±s.e.m. slope conductance of 37.6 ± 0.8 pS (r2= 0.997) for the inward current. F, mean single-channel I–V relationship for background channel activity in Task-3−/− type-1 cells (n= 5 for most points). Mean data for inward currents were fitted by least squares linear regression, which yielded a mean ±s.e.m. slope conductance of 18 ± 0.21 pS (r2= 0.96).