
Figure 3. Background channel activity in cell-attached Task-1−/−/Task-3−/− patches.
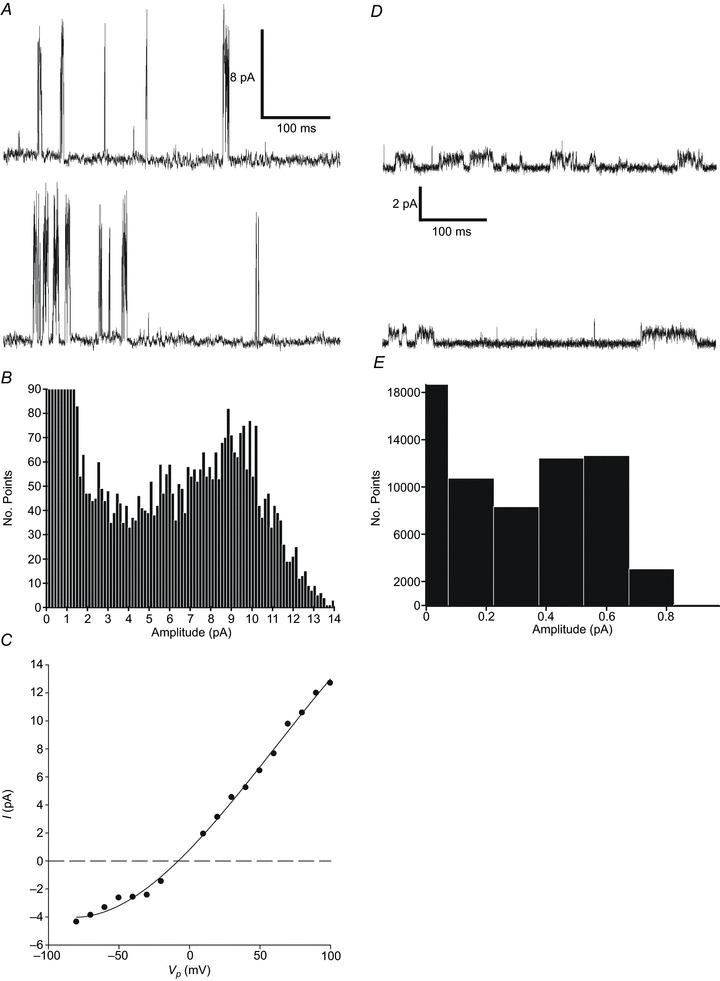
A, cell-attached recording of a large conductance channel in a Task-1−/−/Task-3−/− type-1 cell. Two contiguous 500 ms sections of recording are shown. Recording conditions were as described in Fig. 1. B, all-points histogram generated from a 20 s segment of cell-attached recording under control conditions, with 150 fA bins. C, single-channel current–voltage (I–V) relationship for a large conductance channel present in a Task-1−/−/Task-3−/− null type-1 cell (n= 1). Data for inward currents (n= 2) were fitted by least squares regression and yielded a mean ±s.e.m. slope conductance of 108 ± 4.8 pS (r2= 0.987). D, cell-attached recording of single-channel activity of a small conductance channel from a Task-1−/−/Task-3−/− type-1 cell. E, all-points histogram generated from a 10 s segment of cell-attached recording under control conditions, with 150 fA bins. Calculation of single-channel conductance at 80 mV yielded a value of 7.5 pS.