
Figure 4. Task-1−/− and Task-3−/− single-channel summary.
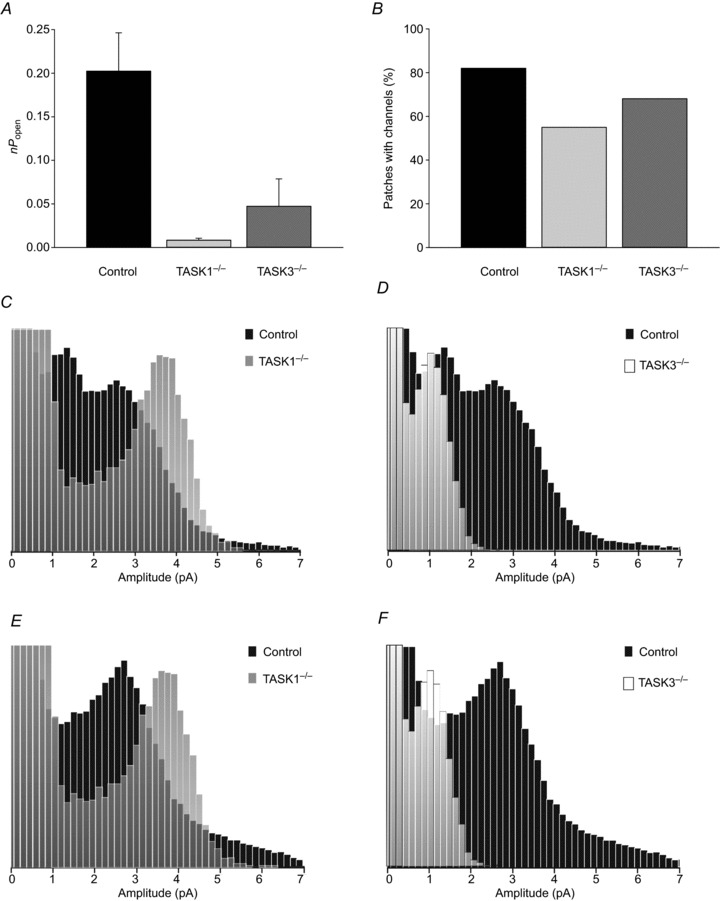
A, nPopen values for channel activity calculated under normoxic conditions at 80 mV Vp for control (n= 30), Task-1−/− (n= 21) and Task-3−/− (n= 17) type-1 cells. B, numbers of channel-containing patches as a percentage of total patches for control (n= 45), Task-1−/− (n= 44), and Task-3−/− (n= 32) cells. C, D, all-points histogram from a control type-1 cell with Task-1−/− and Task-3−/− superimposed, respectively. E, F, alternative all-points histogram from a control type-1 cell with Task-1−/− and Task-3−/−, respectively. Note all histograms in this figure have been arbitrarily scaled such that peaks in the different histograms are of similar size.