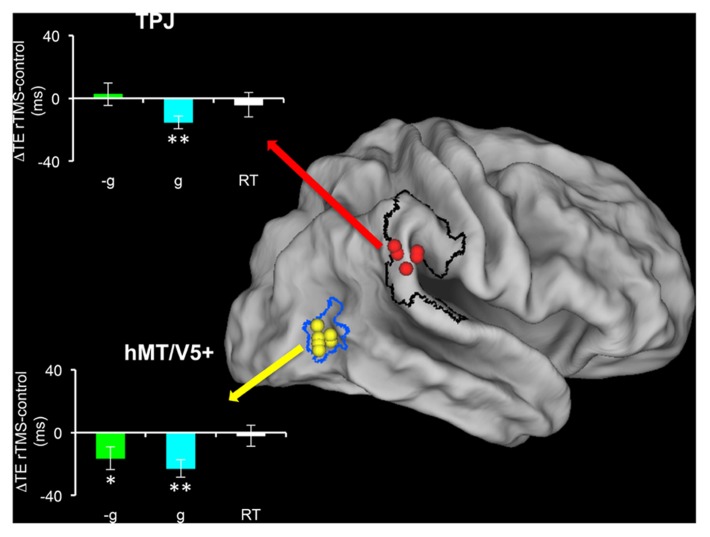
FIGURE 4.
Effects of repetitive transcranial magnetic stimulation (rTMS) of TPJ and hMT/V5+ on the interception of targets descending along the vertical with natural (1g) or artificial (-1g) acceleration (modified with permission from Bosco et al., 2008). Individual TMS sites in TPJ (red) and hMT/V5+ (yellow) are mapped on the Caret PALS human brain (slightly inflated). hMT/V5+ borders (blue) are derived from the probabilistic map of Malikovic et al. (2007), while the black contour delimits the perisylvian region (including TPJ) activated by vestibular caloric stimulation in Indovina et al. (2005). Bar graphs show the mean timing differences (±SEM) between post-rTMS and pre-rTMS interceptive responses. Cyan, 1g targets; green, –1g targets; white, simple reaction time task, which controlled for specificity of rTMS effects. *p < 0.05; **p < 0.001 (repeated-measures ANOVA).

