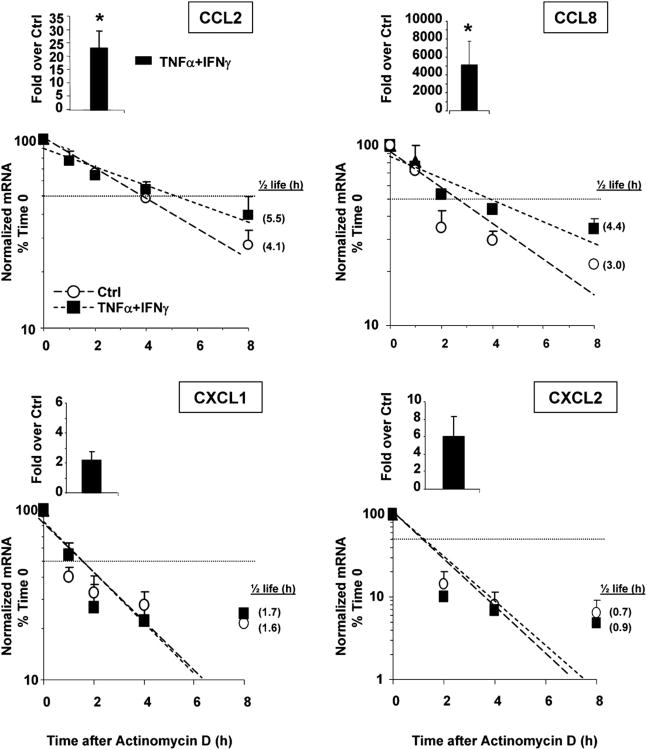
Figure 3.
Stimulus-dependent increase in mRNA stability in a subset of HuR targets. Chemokine mRNA expression in BEAS-2B cells harvested 18 h after the indicated treatment (50 ng/ml each stimulus, time 0) and following actinomycin D treatment (3 μg/ml) for the indicated times (n = 3–4). mRNA was detected by real-time RT-PCR. Results, normalized to GAPDH mRNA levels, are expressed as fold over unstimulated cells (ctrl) (as 2–ΔΔCt; see Materials and Methods). Levels shown in bar graphs represent the mean ± SEM of results at time 0, showing the induced steady-state mRNA levels. In the line plots, mRNA levels are expressed as mean ± SEM of the percent of maximum (mRNA at time 0). Shown in parenthesis, adjacent to each symbol, is the mRNA half-life, calculated for each condition as the time (in hours) required for the transcript to decrease to 50% (dotted horizontal line) of its initial abundance [t1/2 = Ln(0.5)/slope]. *p < 0.05 versus unstimulated cells.

