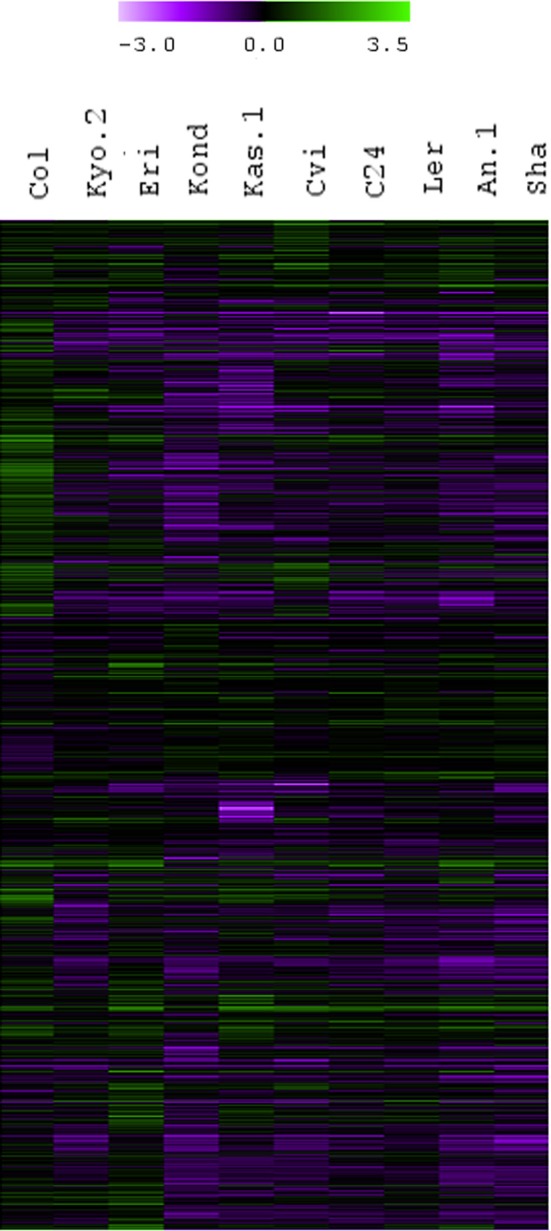
Figure 2.

Fold change values (treatment vs. control) calculated from normalized expression index for top 1000 significant genes from all the 10 ecotypes. Hierarchical clustering (HCL) was performed with Pearson correlation using average linkage method and 10,000 bootstrapping for the top 1000 heat regulated transcripts based on fold-change ratios compared to their respective controls.
