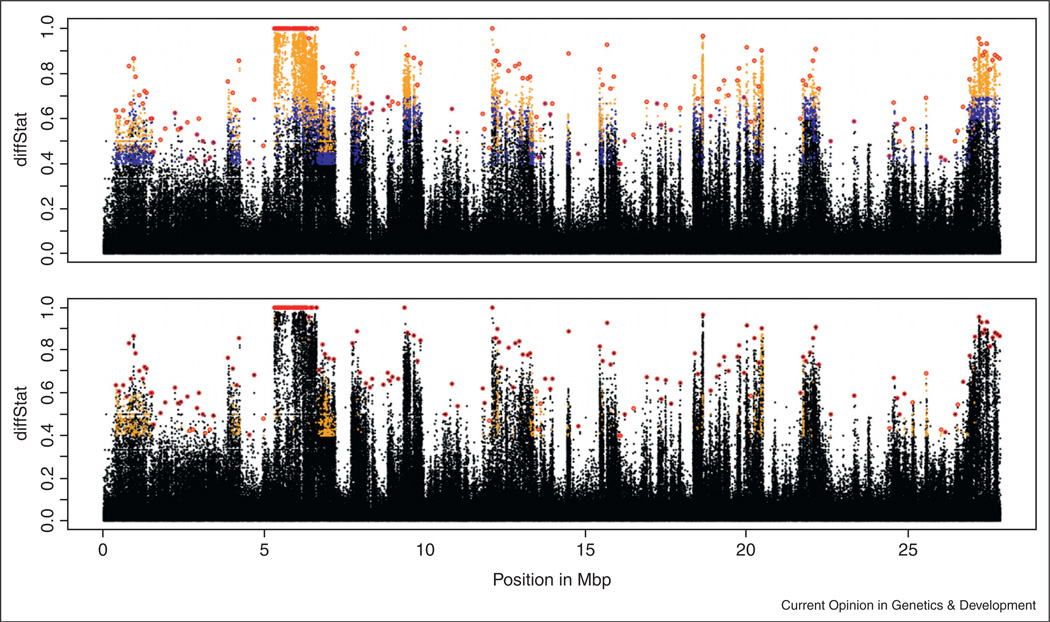
Figure 1.
Differentiated polymorphisms on chromosome arm 3R, reproduced from Turner et al. [22•], Figure 4, with a following Figure Legend. The diffStat is shown for each variant that had higher or lower allele frequencies in the large-selected lines compared to the small-selected lines. Above: Color coding indicates significance: black = nonsignificant variants, blue = significant variants at the permissive FDR threshold (FDR < 10%); gold = significant variants at the restrictive FDR threshold (FDR < 5%); red = peak variants. Below: Color coding indicates estimated starting allele frequency: black = all variants, gold = variants with an average control frequency <0.05; red circles indicate peak variants, as in A. When 50 kb regions around strongest selected sites are assumed to be changing in frequency due to local hitch-hiking, the estimate for the number of selected polymorphisms is reduced to ~ 300. http://dx.doi.org/10.1371/journal.pgen.1001336.g004.

