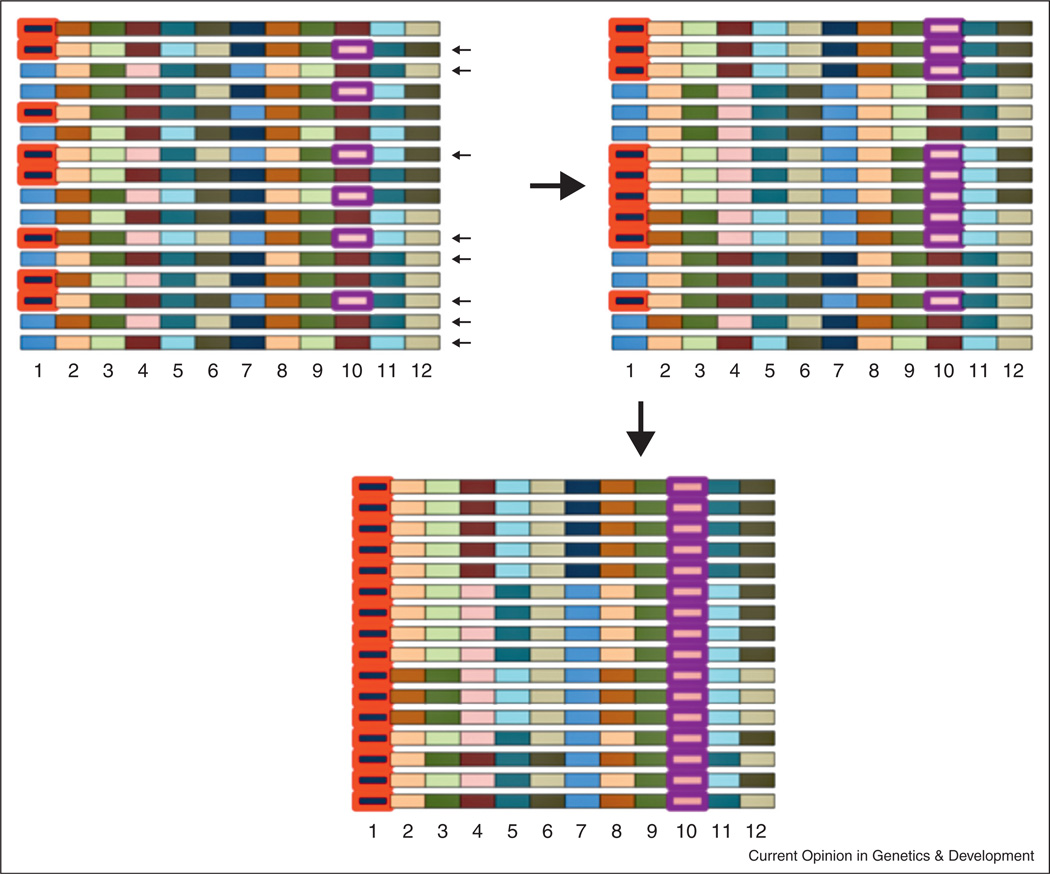
Figure 2.
Sampling disequilibrium and its consequences in HHR mapping. A model or a natural population is shown on the top left. Each chromosome is conceptualized as a set of LD blocks, where LD is complete within each block but absent between blocks. There are 2 alleles (different colors) within each block (numbered 1–12). When a subset of chromosomes are sampled to found a population, sampling LD can associate non-adjacent LD blocks. For example, if the chromosomes indicated by small black arrows are sampled, the descendents would have LD between blocks 1 and 10 (top right). If one allele is then selected (circled in red), alleles at another locus can hitchhike (circled in purple). Because allele frequency between these blocks is changed less, this process could create many seemingly independent “peaks” along a chromosome despite only a subset of peaks containing a selected allele.

