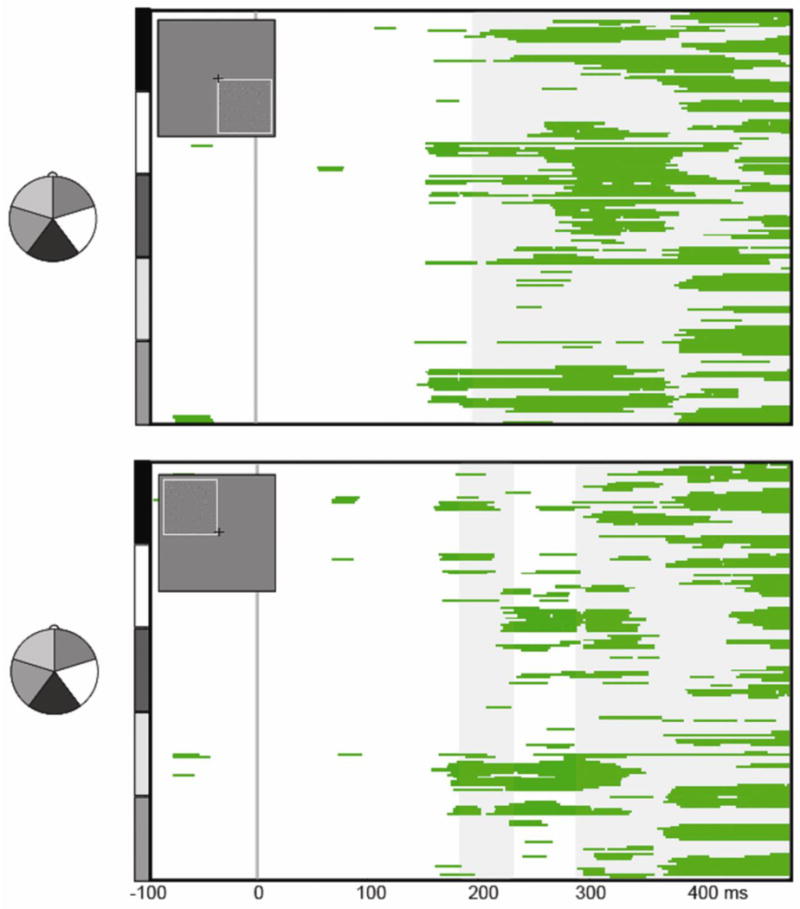
Figure 4. Statistical Cluster Plots of Contour Effects.

The statistical cluster plots depict significant differences between CON and NOCON conditions from pair-wise running t-tests (threshold criterion of p<0.05 for 19.5 consecutive msec), for the lower right (upper panel) and upper left (lower panel) presentations. Electrodes are arranged vertically according to the head montage on the left. This illustrates that contour effects onset in the timeframe of the N1 (∼170 ms), and persisted into the Ncl timeframe (∼200-350 ms). Gray shading reflects periods of topographic divergence between the CON and NOCON responses according to the TANOVA analysis.
