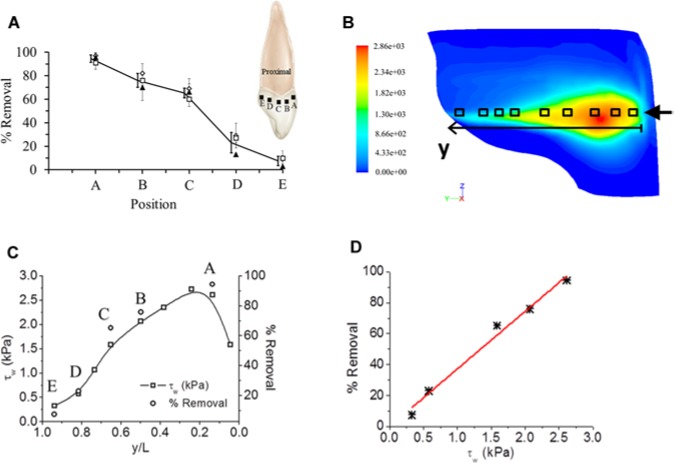
Figure 3.
Biofilm removal as a function of shear stress and distance from the front of the tooth. (A) Percentage removal of the biofilm quantified from the CLSM images at 5 different locations on the tooth surface in the IP space. Three individual runs are shown by different symbols. The error bars represent standard deviations of the mean from 5 CLSM images. Solid line and heavy bars are the mean of the individual means (n = 3), which have been slightly offset for clarity. The schematic inset shows the proximal view of the upper central incisor, where the black squares represent the different locations where the CLSM images were taken. (B) Contour map showing the spatial distribution of τw on the tooth surface, as calculated from numerical simulations (circular nozzle tip; z/H = 0.5). The color bar is a linear scale showing the shear stress (Pa). (C) τw on the tooth surface (in kPa) at different y-positions along the tooth (i.e., from labial to palatal side), at a fixed z-position (gingivo-incisal), as also calculated from numerical simulations. Empty squares correspond to the measurement points (squares) in 3B. On the secondary y-axis, the mean percentage removal measured experimentally in 3A (i.e., solid line) is plotted, with the 5 empty circles (denoted as A, B, C, D, and E) corresponding to the same positions as in 3A. (D) Relationship between percentage removal (determined experimentally) and τw on the tooth surface (determined computationally). Datapoints were interpolated with a linear trend (red line).

